## Diagram: Predetermined vs. Per-View Data Flow Architecture
### Overview
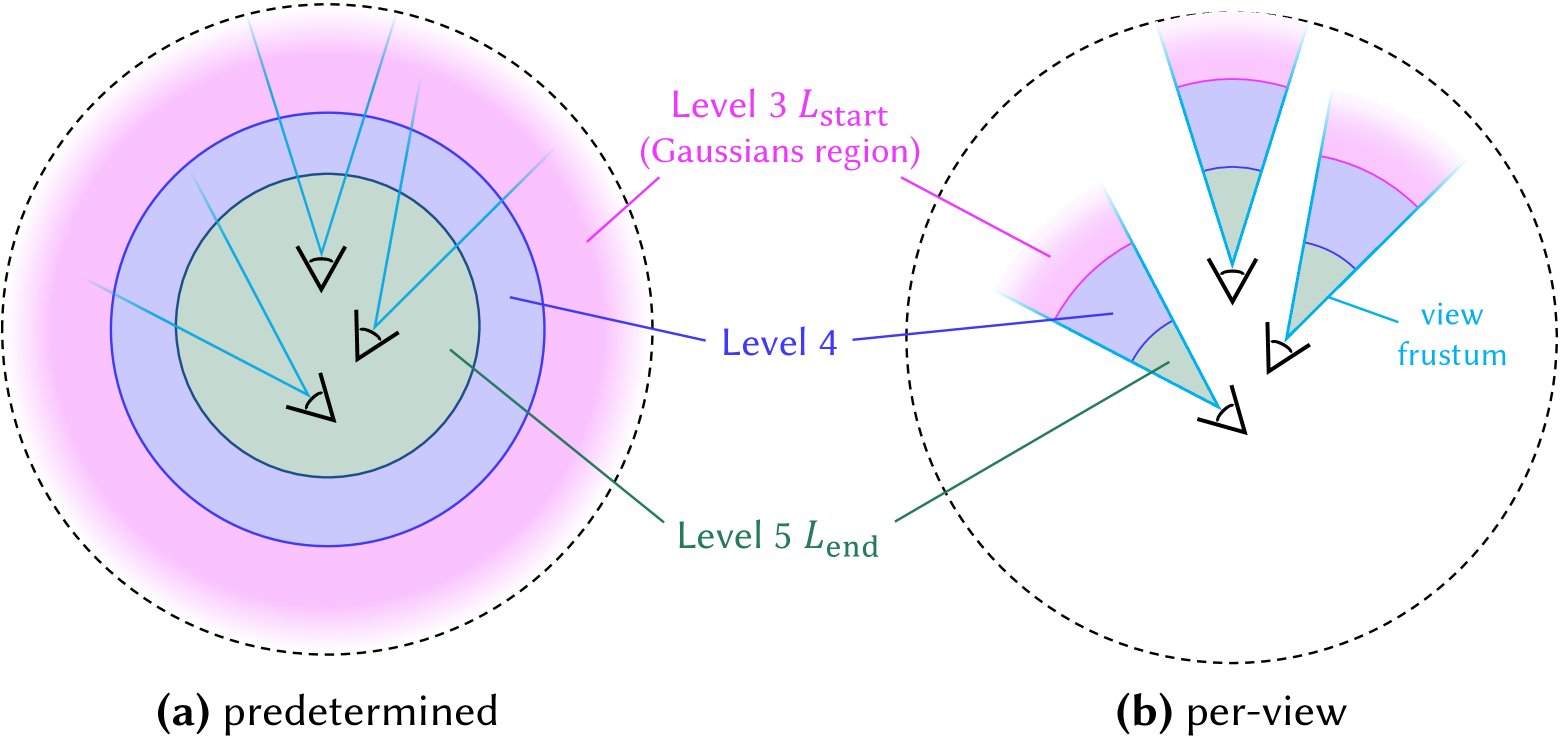
The image presents two side-by-side diagrams comparing data flow architectures: (a) "predetermined" and (b) "per-view". Both use concentric circular layers with directional arrows to represent hierarchical processing stages. The diagrams emphasize spatial relationships between processing levels and directional data flow.
### Components/Axes
**Diagram (a) - Predetermined Flow**
- **Outermost Layer**: Dashed black circle labeled "Level 3 L_start (Gaussians region)" (pink text)
- **Middle Layer**: Solid purple circle labeled "Level 4" (blue text)
- **Innermost Layer**: Solid green circle labeled "Level 5 L_end" (green text)
- **Arrows**: Blue directional arrows pointing inward from outer to inner layers, annotated with angular measurements (degrees)
**Diagram (b) - Per-View Flow**
- **Outermost Layer**: Dashed black circle labeled "Level 3 L_start" (pink text)
- **Middle Layer**: Solid purple circle labeled "Level 4" (blue text)
- **Innermost Layer**: Solid green circle labeled "Level 5 L_end" (green text)
- **Arrows**: Blue directional arrows labeled "view frustum" pointing outward from inner to outer layers, with angular annotations
### Detailed Analysis
**Diagram (a) Features**
1. Gaussian region annotation in Level 3 suggests probabilistic data distribution
2. Inward arrow flow implies top-down processing
3. Angular measurements on arrows indicate directional precision requirements
**Diagram (b) Features**
1. View frustum annotation connects to computer graphics terminology
2. Outward arrow flow suggests bottom-up processing
3. Angular measurements maintain consistency with diagram (a)
### Key Observations
1. Both diagrams share identical layer structure but reverse data flow direction
2. Gaussian region annotation is exclusive to diagram (a)
3. View frustum annotation is exclusive to diagram (b)
4. Color coding remains consistent across both diagrams:
- Pink: Level 3 (start)
- Purple: Level 4 (intermediate)
- Green: Level 5 (end)
### Interpretation
These diagrams appear to represent two approaches to multi-stage data processing:
1. **Predetermined Flow (a)**:
- Top-down architecture with Gaussian-based initialization
- Suggests probabilistic modeling at initial stages
- Fixed processing path from Level 3 to Level 5
2. **Per-View Flow (b)**:
- Bottom-up architecture utilizing view frustum culling
- Implies dynamic processing based on visible elements
- Processing path reverses from Level 5 to Level 3
The architectural difference highlights a fundamental tradeoff between predetermined probabilistic modeling (a) and view-dependent optimization (b). The consistent angular measurements across both diagrams suggest shared geometric constraints in the processing pipeline.