# Technical Document Extraction: Network Device Topology and Fault State
## 1. Document Overview
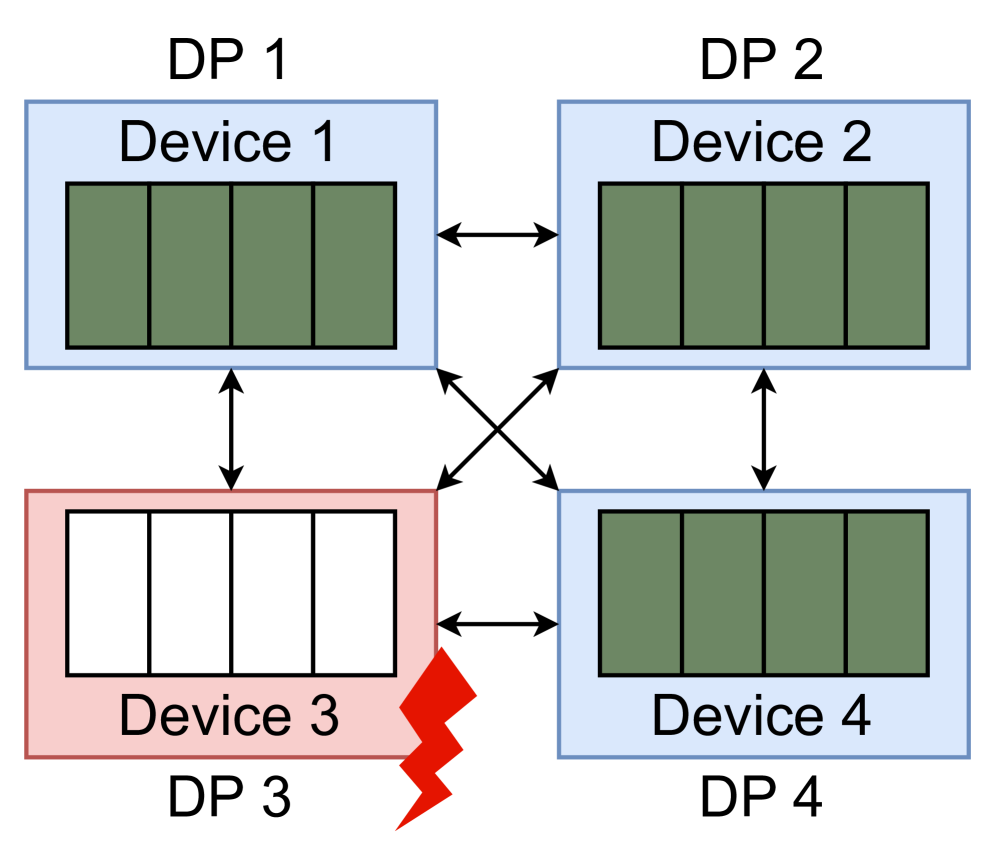
This image is a technical diagram illustrating a four-node network or system topology. It depicts the connectivity between four distinct devices (labeled Device 1 through Device 4) and highlights a failure state associated with one of the nodes.
---
## 2. Component Isolation
### Region A: Upper Nodes (Healthy State)
* **DP 1 / Device 1 (Top-Left):**
* **Container:** Light blue rectangular box.
* **Internal State:** Contains four vertical green rectangles, indicating active or healthy internal modules/sub-components.
* **DP 2 / Device 2 (Top-Right):**
* **Container:** Light blue rectangular box.
* **Internal State:** Contains four vertical green rectangles, indicating active or healthy internal modules/sub-components.
### Region B: Lower Nodes (Mixed State)
* **DP 3 / Device 3 (Bottom-Left):**
* **Container:** Light red rectangular box, indicating a fault or error state.
* **Internal State:** Contains four vertical white (empty) rectangles, indicating that the internal modules/sub-components are inactive or have failed.
* **Visual Indicator:** A large red lightning bolt icon is positioned at the bottom right corner of this device block, signifying a critical failure or electrical fault.
* **DP 4 / Device 4 (Bottom-Right):**
* **Container:** Light blue rectangular box.
* **Internal State:** Contains four vertical green rectangles, indicating active or healthy internal modules/sub-components.
---
## 3. Connectivity and Flow (Full Mesh Topology)
The diagram utilizes double-headed black arrows to represent bidirectional communication or power paths between the devices. The arrangement constitutes a **Full Mesh Topology**, where every node is connected to every other node.
| Connection Path | Description |
| :--- | :--- |
| **Horizontal (Top)** | Device 1 $\leftrightarrow$ Device 2 |
| **Horizontal (Bottom)** | Device 3 $\leftrightarrow$ Device 4 |
| **Vertical (Left)** | Device 1 $\leftrightarrow$ Device 3 |
| **Vertical (Right)** | Device 2 $\leftrightarrow$ Device 4 |
| **Diagonal (Backslash)** | Device 1 $\leftrightarrow$ Device 4 |
| **Diagonal (Forward slash)** | Device 2 $\leftrightarrow$ Device 3 |
---
## 4. Textual Data Extraction
| Label Type | Extracted Text |
| :--- | :--- |
| **Primary Headers** | DP 1, DP 2, DP 3, DP 4 |
| **Secondary Labels** | Device 1, Device 2, Device 3, Device 4 |
---
## 5. Technical Summary of Trends and Data
* **Operational Status:** 75% of the system (Devices 1, 2, and 4) is operational, indicated by the blue housing and green internal status bars.
* **Failure Point:** 25% of the system (Device 3) is in a failed state, indicated by the red housing, empty (white) status bars, and the red lightning bolt symbol.
* **Redundancy:** Despite the failure of Device 3 (DP 3), the mesh connectivity suggests that paths still exist between the remaining healthy nodes (1, 2, and 4), though any data or processes dependent on Device 3 are currently compromised.