# Technical Diagram Analysis
## Diagram Overview
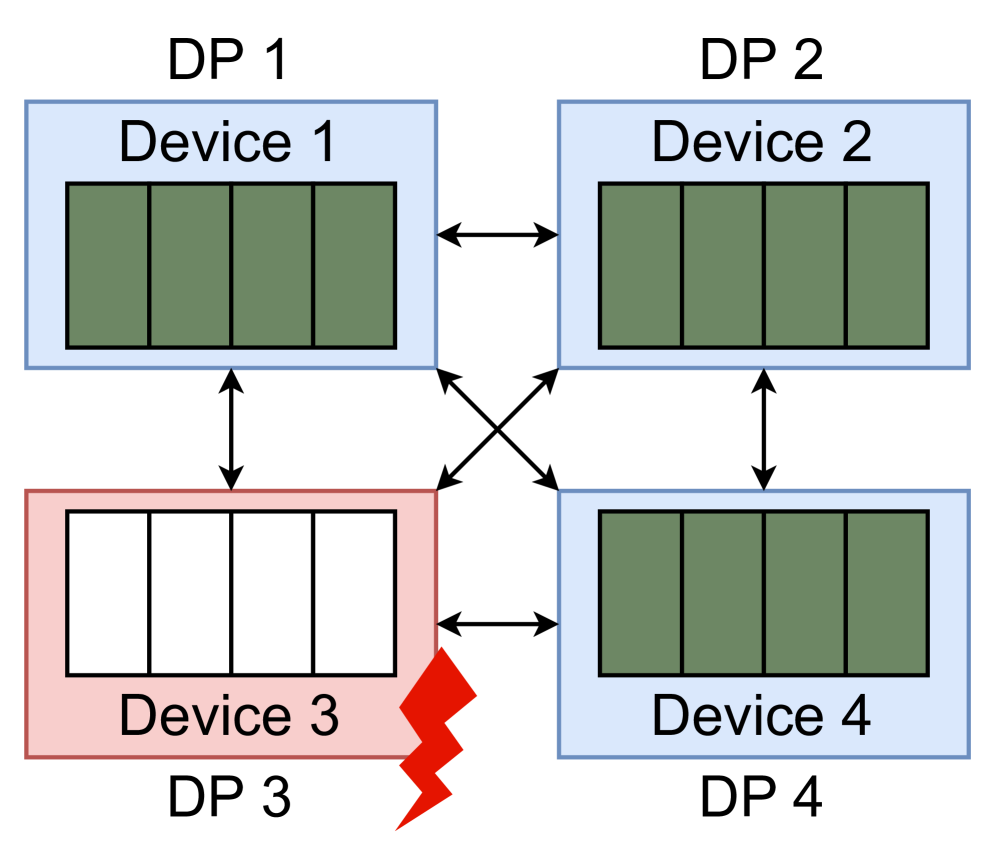
The image depicts a network topology diagram with four devices labeled DP 1–DP 4, connected via bidirectional arrows. Device 3 is highlighted with a red fault indicator.
---
## Component Breakdown
### Device 1 (DP 1)
- **Label**: "Device 1" (blue box)
- **Visual Representation**: Four green rectangles stacked vertically
- **Connections**:
- Bidirectional arrow to Device 2 (DP 2)
- Unidirectional arrow from Device 3 (DP 3)
### Device 2 (DP 2)
- **Label**: "Device 2" (blue box)
- **Visual Representation**: Four green rectangles stacked vertically
- **Connections**:
- Bidirectional arrow to Device 1 (DP 1)
- Unidirectional arrow to Device 4 (DP 4)
### Device 3 (DP 3)
- **Label**: "Device 3" (red box)
- **Visual Representation**: Four white rectangles stacked vertically
- **Distinctive Feature**: Red lightning bolt icon in bottom-right corner
- **Connections**:
- Unidirectional arrow to Device 1 (DP 1)
- Unidirectional arrow to Device 4 (DP 4)
### Device 4 (DP 4)
- **Label**: "Device 4" (blue box)
- **Visual Representation**: Four green rectangles stacked vertically
- **Connections**:
- Bidirectional arrow to Device 2 (DP 2)
- Unidirectional arrow from Device 3 (DP 3)
---
## Connection Flow
1. **DP 1 ↔ DP 2**: Bidirectional communication channel
2. **DP 3 → DP 1**: Unidirectional data flow
3. **DP 3 → DP 4**: Unidirectional data flow
4. **DP 2 → DP 4**: Unidirectional data flow
---
## Fault Indication
- **Device 3 (DP 3)** is marked with a red lightning bolt, indicating:
- Active fault state
- Potential power surge or electrical anomaly
- Critical failure point in the network
---
## Color Coding
- **Blue Boxes**: DP 1, DP 2, DP 4 (normal operational devices)
- **Red Box**: DP 3 (faulted device)
- **Green Rectangles**: Standard device components
- **White Rectangles**: Faulted device components
- **Red Lightning Bolt**: Electrical fault indicator
---
## Spatial Grounding
- All devices are arranged in a 2x2 grid layout
- Arrows maintain consistent directionality (→ for outgoing, ← for incoming)
- Fault indicator positioned at Device 3's lower-right quadrant
---
## Key Observations
1. Device 3 (DP 3) acts as a central fault source affecting multiple connections
2. DP 1 and DP 2 maintain mutual communication while DP 3 and DP 4 form a secondary communication path
3. The red lightning bolt suggests Device 3 may be causing network instability
---
## Diagram Purpose
This appears to represent a network fault scenario where:
- Devices 1 and 2 maintain normal operations
- Device 3 (DP 3) introduces a critical failure affecting connected systems
- Device 4 (DP 4) receives data from both DP 2 and DP 3
---
## Missing Elements
- No explicit legend present
- No numerical data or quantitative measurements
- No temporal indicators (e.g., time stamps)
- No scale or measurement units
---
## Conclusion
The diagram illustrates a network fault scenario with Device 3 (DP 3) as the primary failure point, affecting multiple system components through unidirectional data flows. The bidirectional connection between DP 1 and DP 2 suggests a resilient subsystem unaffected by the fault.