## Flowchart: System Architecture for vLLM Workers with RL Integration
### Overview
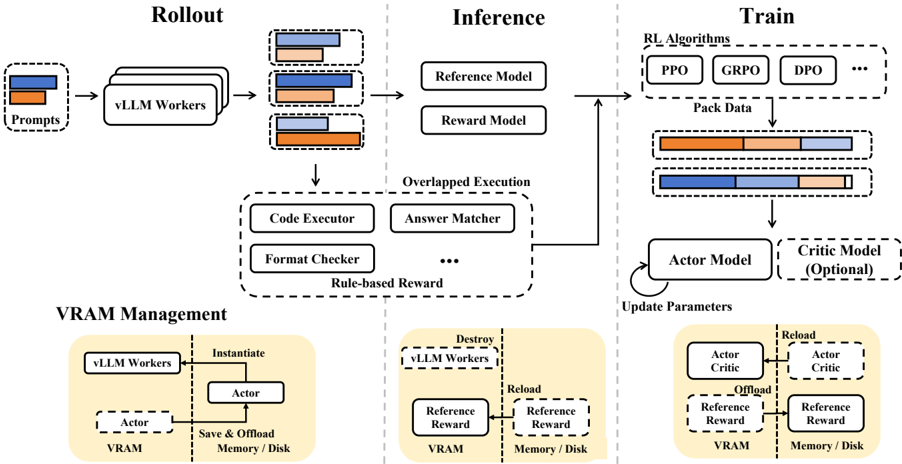
The diagram illustrates a three-phase system architecture for managing vLLM (Large Language Model) workers, integrating reinforcement learning (RL) components. It includes Rollout, Inference, and Train phases, with VRAM Management at the bottom. Key components involve model execution, reward modeling, and memory/disk resource management.
---
### Components/Axes
#### Rollout Phase
- **Inputs**: Prompts (orange/blue bars)
- **Process**: vLLM Workers
- **Outputs**:
- Reference Model (orange bar)
- Reward Model (blue bar)
- Overlapped Execution (gray bar)
#### Inference Phase
- **Components**:
- Code Executor
- Answer Matcher
- Format Checker
- Rule-based Reward
- **Models**:
- Reference Model (orange)
- Reward Model (blue)
- **Legend**:
- Orange: Reference Model
- Blue: Reward Model
- Gray: Overlapped Execution
#### Train Phase
- **RL Algorithms**: PPO, GRPO, DPO
- **Data Packing**:
- Actor Model (orange)
- Critic Model (blue, optional)
- Reference Reward (gray)
- **Flow**:
- Pack Data → Update Parameters → Actor/Critic Models → VRAM
#### VRAM Management
- **Actors**: Instantiate, Save & Offload Memory/Disk
- **Flow**:
- vLLM Workers ↔ Actor ↔ VRAM ↔ Memory/Disk
---
### Detailed Analysis
1. **Rollout Phase**:
- Prompts (orange/blue) feed into vLLM Workers.
- Outputs split into Reference Model (orange), Reward Model (blue), and Overlapped Execution (gray).
2. **Inference Phase**:
- Overlapped Execution includes Code Executor, Answer Matcher, Format Checker, and Rule-based Reward.
- Reference Model and Reward Model are visually distinct via color coding.
3. **Train Phase**:
- RL algorithms (PPO, GRPO, DPO) process Pack Data segmented into Actor (orange), Critic (blue), and Reference Reward (gray).
- Critic Model is marked as optional.
4. **VRAM Management**:
- Actors handle memory/disk operations (Save/Offload) for vLLM Workers and models.
---
### Key Observations
- **Color Consistency**: Orange, blue, and gray consistently represent Reference Model, Reward Model, and Overlapped Execution across phases.
- **Optional Component**: Critic Model in Train phase is explicitly labeled as optional.
- **Memory Flow**: VRAM Management shows bidirectional interaction between vLLM Workers, Actors, and storage systems.
---
### Interpretation
This architecture demonstrates a hybrid system where:
1. **Rollout** initializes model execution and reward signals.
2. **Inference** combines execution with rule-based validation and model-based rewards.
3. **Train** uses RL algorithms to optimize Actor/Critic models, with Critic being optional for flexibility.
4. **VRAM Management** ensures efficient resource allocation, critical for scaling vLLM operations.
The system emphasizes modularity (separate phases) and resource efficiency (VRAM management), with RL integration enabling adaptive learning. The optional Critic Model suggests scalability for different use cases.