## Bar Chart: Llama3-8B-Instruct Performance
### Overview
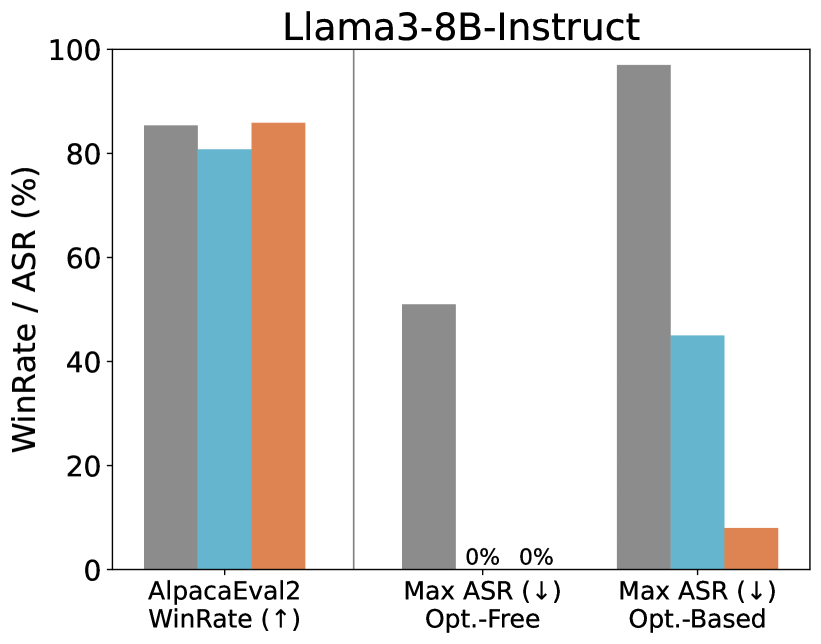
The image is a bar chart comparing the performance of "Llama3-8B-Instruct" across different metrics: AlpacaEval2 WinRate, Max ASR (Opt.-Free), and Max ASR (Opt.-Based). The chart displays the WinRate/ASR percentage on the y-axis and the different evaluation metrics on the x-axis. Three bars of different colors (gray, cyan, and orange) are used to represent different aspects of performance for each metric.
### Components/Axes
* **Title:** Llama3-8B-Instruct
* **Y-axis:** WinRate / ASR (%)
* Scale: 0 to 100, with tick marks at 20, 40, 60, 80, and 100.
* **X-axis:**
* Category 1: AlpacaEval2 WinRate (↑)
* Category 2: Max ASR (↓) Opt.-Free
* Category 3: Max ASR (↓) Opt.-Based
* **Bar Colors:**
* Gray: Unspecified (likely a baseline or reference model)
* Cyan: Unspecified (likely a different model or configuration)
* Orange: Unspecified (likely a different model or configuration)
### Detailed Analysis
Here's a breakdown of the bar heights for each category and color:
* **AlpacaEval2 WinRate (↑):**
* Gray: Approximately 85%
* Cyan: Approximately 81%
* Orange: Approximately 86%
* **Max ASR (↓) Opt.-Free:**
* Gray: Approximately 51%
* Cyan: 0%
* Orange: 0%
* **Max ASR (↓) Opt.-Based:**
* Gray: Approximately 97%
* Cyan: Approximately 45%
* Orange: Approximately 8%
### Key Observations
* For AlpacaEval2 WinRate, the performance is relatively high across all three bars, with the orange bar showing a slightly higher win rate.
* For Max ASR (Opt.-Free), the gray bar has a significant value, while the cyan and orange bars are at 0%.
* For Max ASR (Opt.-Based), the gray bar has the highest value, followed by the cyan bar, and the orange bar has the lowest value.
### Interpretation
The chart compares the performance of Llama3-8B-Instruct on AlpacaEval2 WinRate and Max ASR under different optimization conditions (Opt.-Free and Opt.-Based). The different colored bars likely represent different configurations or models being compared.
* **AlpacaEval2 WinRate:** The models perform similarly on this metric, suggesting a consistent level of general instruction-following ability.
* **Max ASR (Opt.-Free):** The gray bar's non-zero value, while the other two are zero, suggests that the gray configuration might have a higher tendency to generate adversarial outputs without specific optimization to prevent it.
* **Max ASR (Opt.-Based):** The significant differences between the bars indicate that the optimization strategy has a substantial impact on the model's vulnerability to adversarial attacks. The orange bar's low value suggests that the corresponding configuration is more robust against such attacks when optimization is applied.
The data suggests that while the models have comparable general performance (AlpacaEval2), their robustness against adversarial attacks (Max ASR) varies significantly depending on the optimization strategy used. The "Opt.-Based" optimization seems to improve the model's resistance to adversarial attacks, especially for the configuration represented by the orange bar.