\n
## Bar Chart: Llama3-8B-Instruct Performance
### Overview
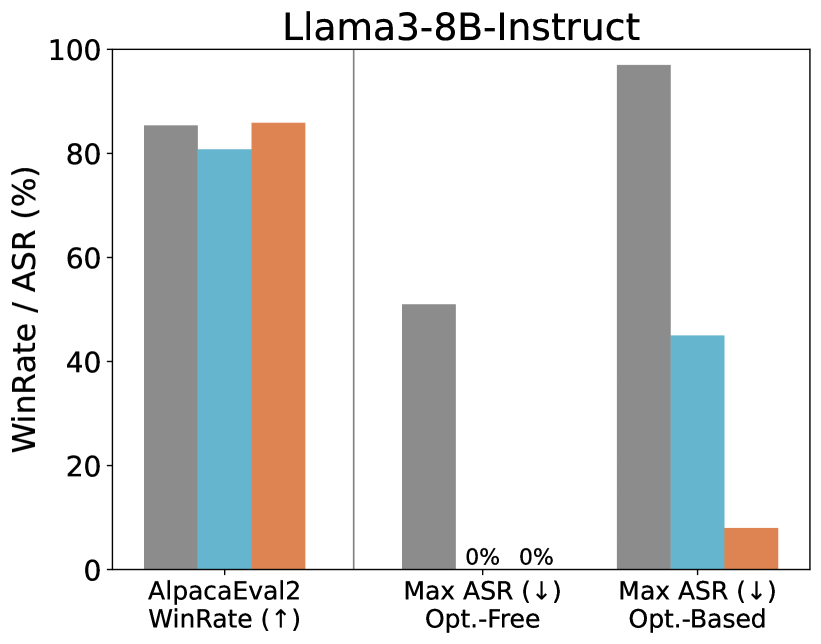
This bar chart compares the performance of the Llama3-8B-Instruct model across different evaluation metrics: AlpacaEval2 WinRate, Max ASR (with and without optimization), and Max ASR (optimization-based). The chart uses grouped bars to represent different models or configurations within each metric. The y-axis represents WinRate/ASR as a percentage, ranging from 0 to 100.
### Components/Axes
* **Title:** Llama3-8B-Instruct (positioned at the top-center)
* **X-axis Label:** Evaluation Metrics (AlpacaEval2 WinRate, Max ASR Opt.-Free, Max ASR Opt.-Based)
* **Y-axis Label:** WinRate / ASR (%) (ranging from 0 to 100)
* **Legend:** Implicitly defined by the color of the bars.
* Grey: Represents one model/configuration.
* Teal/Cyan: Represents another model/configuration.
* Orange: Represents a third model/configuration.
* **X-axis Markers:** AlpacaEval2 WinRate (↑), Max ASR (↓) Opt.-Free, Max ASR (↓) Opt.-Based. The arrows indicate whether higher or lower values are better for the metric.
### Detailed Analysis
The chart consists of three groups of bars, each corresponding to one of the evaluation metrics. Within each group, there are three bars representing different configurations.
**1. AlpacaEval2 WinRate (↑)**
* Grey Bar: Approximately 86%
* Teal Bar: Approximately 79%
* Orange Bar: Approximately 85%
* Trend: The grey and orange bars are higher than the teal bar, indicating better performance on AlpacaEval2 WinRate.
**2. Max ASR (↓) Opt.-Free**
* Grey Bar: Approximately 52%
* Teal Bar: Approximately 0%
* Orange Bar: Approximately 0%
* Trend: The grey bar is significantly higher than the teal and orange bars. Since this is an ASR metric (lower is better), the grey configuration performs worse.
**3. Max ASR (↓) Opt.-Based**
* Grey Bar: Approximately 100%
* Teal Bar: Approximately 45%
* Orange Bar: Approximately 8%
* Trend: The grey bar is significantly higher than the teal and orange bars. Again, since this is an ASR metric (lower is better), the grey configuration performs worse.
### Key Observations
* The grey configuration consistently performs differently than the teal and orange configurations across all metrics.
* The Max ASR metrics show a clear difference between the "Opt.-Free" and "Opt.-Based" configurations, with optimization generally leading to lower ASR values (better performance) for the teal and orange configurations.
* The teal and orange configurations have similar performance on AlpacaEval2 WinRate, but diverge significantly on the Max ASR metrics.
### Interpretation
The chart suggests that the Llama3-8B-Instruct model exhibits varying performance depending on the evaluation metric and configuration. The grey configuration appears to be an outlier, performing well on WinRate but poorly on ASR. The teal and orange configurations demonstrate a trade-off between WinRate and ASR, with optimization improving ASR but potentially impacting WinRate. The "↑" and "↓" symbols on the x-axis are crucial for interpreting the results correctly; higher WinRate is desirable, while lower ASR is desirable. The data suggests that the model's performance is sensitive to the optimization strategy used, and the optimal configuration may depend on the specific application and desired balance between WinRate and ASR. The large differences in the Max ASR values indicate that optimization has a substantial impact on the model's ability to avoid errors.