## Bar Chart: Llama3-8B-Instruct Performance Metrics
### Overview
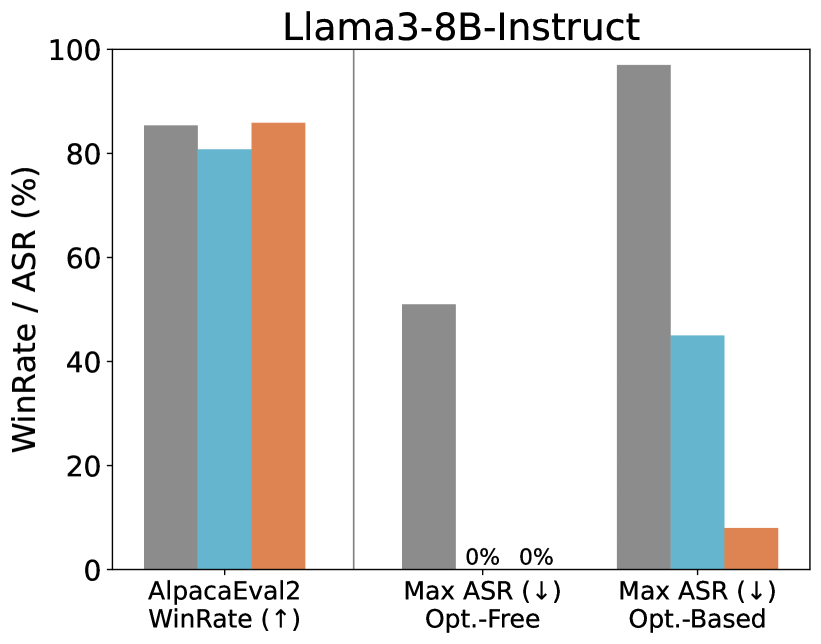
The chart compares performance metrics (WinRate and ASR) for the Llama3-8B-Instruct model across three evaluation scenarios: AlpacaEval2, Max ASR (↓) Opt.-Free, and Max ASR (↓) Opt.-Based. Three data series are represented by color-coded bars: WinRate (↑, gray), Max ASR (↓) Opt.-Free (blue), and Max ASR (↓) Opt.-Based (orange).
### Components/Axes
- **X-axis**: Evaluation scenarios
- AlpacaEval2
- Max ASR (↓) Opt.-Free
- Max ASR (↓) Opt.-Based
- **Y-axis**: WinRate / ASR (%) (0–100)
- **Legend**:
- Gray: WinRate (↑)
- Blue: Max ASR (↓) Opt.-Free
- Orange: Max ASR (↓) Opt.-Based
- **Spatial Grounding**:
- Legend positioned at the bottom-right of the chart
- Bars clustered under each x-axis category
### Detailed Analysis
1. **AlpacaEval2**:
- WinRate (gray): ~85%
- Max ASR (↓) Opt.-Free (blue): ~80%
- Max ASR (↓) Opt.-Based (orange): ~85%
2. **Max ASR (↓) Opt.-Free**:
- WinRate (gray): ~50%
- Max ASR (↓) Opt.-Free (blue): 0% (no bar visible)
- Max ASR (↓) Opt.-Based (orange): 0% (no bar visible)
3. **Max ASR (↓) Opt.-Based**:
- WinRate (gray): ~95%
- Max ASR (↓) Opt.-Free (blue): ~45%
- Max ASR (↓) Opt.-Based (orange): ~10%
### Key Observations
- WinRate (gray) increases significantly from AlpacaEval2 (~85%) to Max ASR Opt.-Based (~95%).
- Max ASR (↓) Opt.-Based (orange) drops sharply from AlpacaEval2 (~85%) to Max ASR Opt.-Based (~10%).
- Max ASR (↓) Opt.-Free (blue) shows a moderate decline from AlpacaEval2 (~80%) to Max ASR Opt.-Based (~45%).
- No data exists for Max ASR (↓) Opt.-Free/Opt.-Based in the Max ASR Opt.-Free scenario.
### Interpretation
The data suggests a trade-off between WinRate and ASR when optimizing the Llama3-8B-Instruct model:
1. **Optimization Impact**:
- Max ASR (↓) Opt.-Based achieves the highest WinRate (~95%) but the lowest ASR (~10%), indicating aggressive optimization reduces error rates at the cost of broader applicability.
- Max ASR (↓) Opt.-Free maintains higher ASR (~45%) but lower WinRate (~50%), suggesting a balance between error tolerance and performance.
2. **AlpacaEval2 Baseline**:
- Represents a middle ground with moderate WinRate (85%) and ASR (80–85%), likely reflecting standard evaluation conditions.
3. **Anomalies**:
- The absence of Max ASR (↓) Opt.-Free/Opt.-Based data in the Max ASR Opt.-Free scenario implies these metrics may not be applicable or were intentionally excluded.
The chart highlights how optimization strategies (Opt.-Free vs. Opt.-Based) differentially impact WinRate and ASR, with Opt.-Based prioritizing WinRate at the expense of ASR.