\n
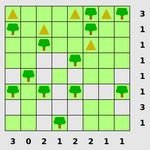
## Grid Map: Distribution of Trees and Shapes
### Overview
The image depicts a grid map with a distribution of two types of symbols: green trees and orange triangles. The grid is labeled with numerical coordinates along both axes. The map appears to represent a spatial distribution of these symbols.
### Components/Axes
* **X-axis:** Labeled with numbers 0 to 3, increasing from left to right.
* **Y-axis:** Labeled with numbers 1 to 3, increasing from bottom to top.
* **Symbols:**
* Green Tree
* Orange Triangle
### Detailed Analysis
The grid is 4 units wide (X-axis) and 3 units high (Y-axis). The following describes the location of each symbol:
* **(0, 1):** Green Tree
* **(0, 3):** Green Tree
* **(1, 1):** Orange Triangle
* **(1, 2):** Green Tree
* **(1, 3):** Orange Triangle
* **(2, 1):** Orange Triangle
* **(2, 2):** Green Tree
* **(2, 3):** Orange Triangle
* **(3, 1):** Green Tree
* **(3, 2):** Green Tree
* **(3, 3):** Orange Triangle
* **(1, 1):** Green Tree
* **(2, 1):** Green Tree
### Key Observations
* There are more green trees (8) than orange triangles (5).
* The orange triangles are more concentrated towards the top of the grid (Y-axis values of 2 and 3).
* The green trees are more evenly distributed across the grid.
* There is a cluster of green trees in the bottom-left corner (X=0, Y=1 and X=0, Y=3).
### Interpretation
The data suggests a non-uniform distribution of trees and shapes across the grid. The higher concentration of orange triangles in the upper portion of the grid could indicate a specific environmental factor or a deliberate placement pattern. The greater number of green trees suggests they are the dominant element in this space. Without additional context, it's difficult to determine the meaning of this distribution. It could represent anything from a forest with clearings to a game map with resource locations. The grid coordinates provide a precise location for each element, allowing for spatial analysis. The lack of a legend beyond the visual distinction of the shapes implies that the shapes themselves are the key identifiers.