## Grid Chart: Symbol Distribution Analysis
### Overview
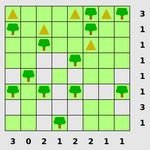
The image depicts a 6x8 grid with numerical labels on the left (vertical axis) and bottom (horizontal axis). Symbols (▲ for triangles, 🌳 for trees) are distributed across cells, with a legend on the right associating symbols with numerical values. The grid appears to represent a categorical distribution of symbols, with axes indicating counts or categories.
### Components/Axes
- **Vertical Axis (Left)**: Labeled with numbers `3, 1, 1, 1, 1, 3, 1` (7 rows). No explicit title, but numbers likely represent row identifiers or counts.
- **Horizontal Axis (Bottom)**: Labeled with numbers `3, 0, 2, 1, 2, 2, 1, 1` (8 columns). No explicit title, but numbers likely represent column identifiers or counts.
- **Legend (Right)**:
- `3` = ▲ (triangle)
- `1` = 🌳 (tree)
- **Grid Cells**: Each cell contains either a triangle (▲) or a tree (🌳), with no overlapping symbols.
### Detailed Analysis
- **Row Counts (Vertical Axis)**:
- Row 1: 3 triangles (▲), 1 tree (🌳)
- Row 2: 1 triangle (▲), 1 tree (🌳)
- Row 3: 1 triangle (▲), 1 tree (🌳)
- Row 4: 1 triangle (▲), 1 tree (🌳)
- Row 5: 1 triangle (▲), 1 tree (🌳)
- Row 6: 3 triangles (▲), 1 tree (🌳)
- **Column Counts (Horizontal Axis)**:
- Column 1: 3 trees (🌳), 1 triangle (▲)
- Column 2: 0 symbols
- Column 3: 2 trees (🌳)
- Column 4: 1 tree (🌳)
- Column 5: 2 trees (🌳)
- Column 6: 2 trees (🌳)
- Column 7: 1 tree (🌳)
- Column 8: 1 tree (🌳)
### Key Observations
1. **Row Patterns**:
- Rows 1 and 6 have the highest triangle density (3 triangles each).
- Rows 2–5 have balanced triangle-to-tree ratios (1:1).
2. **Column Patterns**:
- Columns 2 and 4–8 have sparse tree distribution (0–2 trees).
- Column 1 has the highest tree density (3 trees).
3. **Symbol Distribution**:
- Triangles (▲) are concentrated in rows 1 and 6, while trees (🌳) dominate columns 1, 3, 5, and 6.
- No cell contains both symbols; each cell is exclusively one symbol or empty.
### Interpretation
The grid likely represents a categorical dataset where:
- **Rows** correspond to groups with varying triangle counts (e.g., categories A–F).
- **Columns** correspond to subgroups with varying tree counts (e.g., subcategories 1–8).
- The legend clarifies that symbols represent discrete values (3 for triangles, 1 for trees), but the axes numbers may indicate counts or identifiers rather than direct values.
**Notable Trends**:
- Rows 1 and 6 exhibit extreme triangle dominance, suggesting a possible outlier or special category.
- Columns 2 and 4–8 show minimal tree presence, indicating underrepresentation in these subgroups.
- The absence of overlapping symbols implies mutually exclusive categories (e.g., a cell cannot be both a triangle and a tree).
This structure could model scenarios like resource allocation (triangles = resources, trees = constraints) or survey data (symbols = responses). Further context is needed to confirm the exact application.