# Technical Document Extraction: Failure Analysis Chart
## 1. Component Isolation
* **Header:** Contains the figure title "
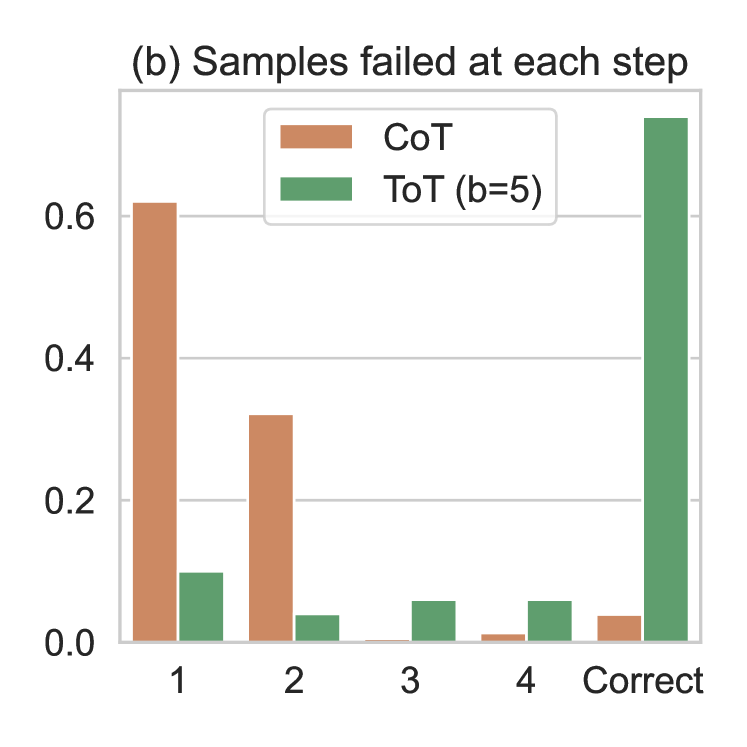
(b) Samples failed at each step".
* **Main Chart Area:** A grouped bar chart showing the distribution of failures across four sequential steps and a final "Correct" category.
* **Legend:** Located in the top-center/right of the plot area, identifying two methodologies.
* **Axes:**
* **Y-axis:** Numerical scale representing a ratio or percentage (0.0 to 0.6+).
* **X-axis:** Categorical labels representing steps (1, 2, 3, 4) and the outcome "Correct".
## 2. Legend and Metadata
* **Legend Position:** [x: ~0.55, y: ~0.85] (Normalized coordinates relative to chart area).
* **Series 1:**
* **Label:** CoT (Chain of Thought)
* **Color:** Burnt Orange / Terracotta
* **Series 2:**
* **Label:** ToT (b=5) (Tree of Thoughts with breadth/branching factor of 5)
* **Color:** Sage Green
## 3. Data Extraction and Trend Verification
### Trend Analysis
* **CoT (Orange):** Shows a "Front-Loaded Failure" trend. The vast majority of failures occur at Step 1, with a significant drop-off at Step 2, and negligible failures in Steps 3 and 4. The "Correct" rate is very low.
* **ToT (b=5) (Green):** Shows a "High Success" trend. Failures are distributed relatively evenly and at low levels across all steps (1-4), with the overwhelming majority of samples reaching the "Correct" state.
### Data Table (Estimated Values)
Values are extracted based on the y-axis grid lines (0.0, 0.2, 0.4, 0.6).
| Step / Category | CoT (Orange) | ToT (b=5) (Green) |
| :--- | :--- | :--- |
| **1** | ~0.62 | ~0.10 |
| **2** | ~0.32 | ~0.04 |
| **3** | ~0.005 | ~0.06 |
| **4** | ~0.01 | ~0.06 |
| **Correct** | ~0.04 | ~0.74 |
## 4. Detailed Component Description
* **Step 1:** CoT experiences its highest failure rate here (over 60%). ToT has a much lower failure rate (approx. 10%).
* **Step 2:** CoT failure rate drops to approximately 32%. ToT failure rate is at its lowest point (approx. 4%).
* **Step 3:** CoT failures are nearly non-existent. ToT failures show a slight uptick to approx. 6%.
* **Step 4:** CoT failures remain negligible (approx. 1%). ToT failures remain steady at approx. 6%.
* **Correct:** This represents the success rate. ToT (b=5) significantly outperforms CoT, with roughly 74% of samples succeeding compared to approximately 4% for CoT.
## 5. Summary of Findings
The chart demonstrates that the **ToT (b=5)** method is substantially more robust than the **CoT** method for the task described. CoT is prone to "early-exit" failures, with nearly 95% of all samples failing within the first two steps. Conversely, ToT maintains a high survival rate through the steps, resulting in a success rate that is roughly 18 times higher than that of CoT.