\n
## Diagram: Ethical Decision-Making Process
### Overview
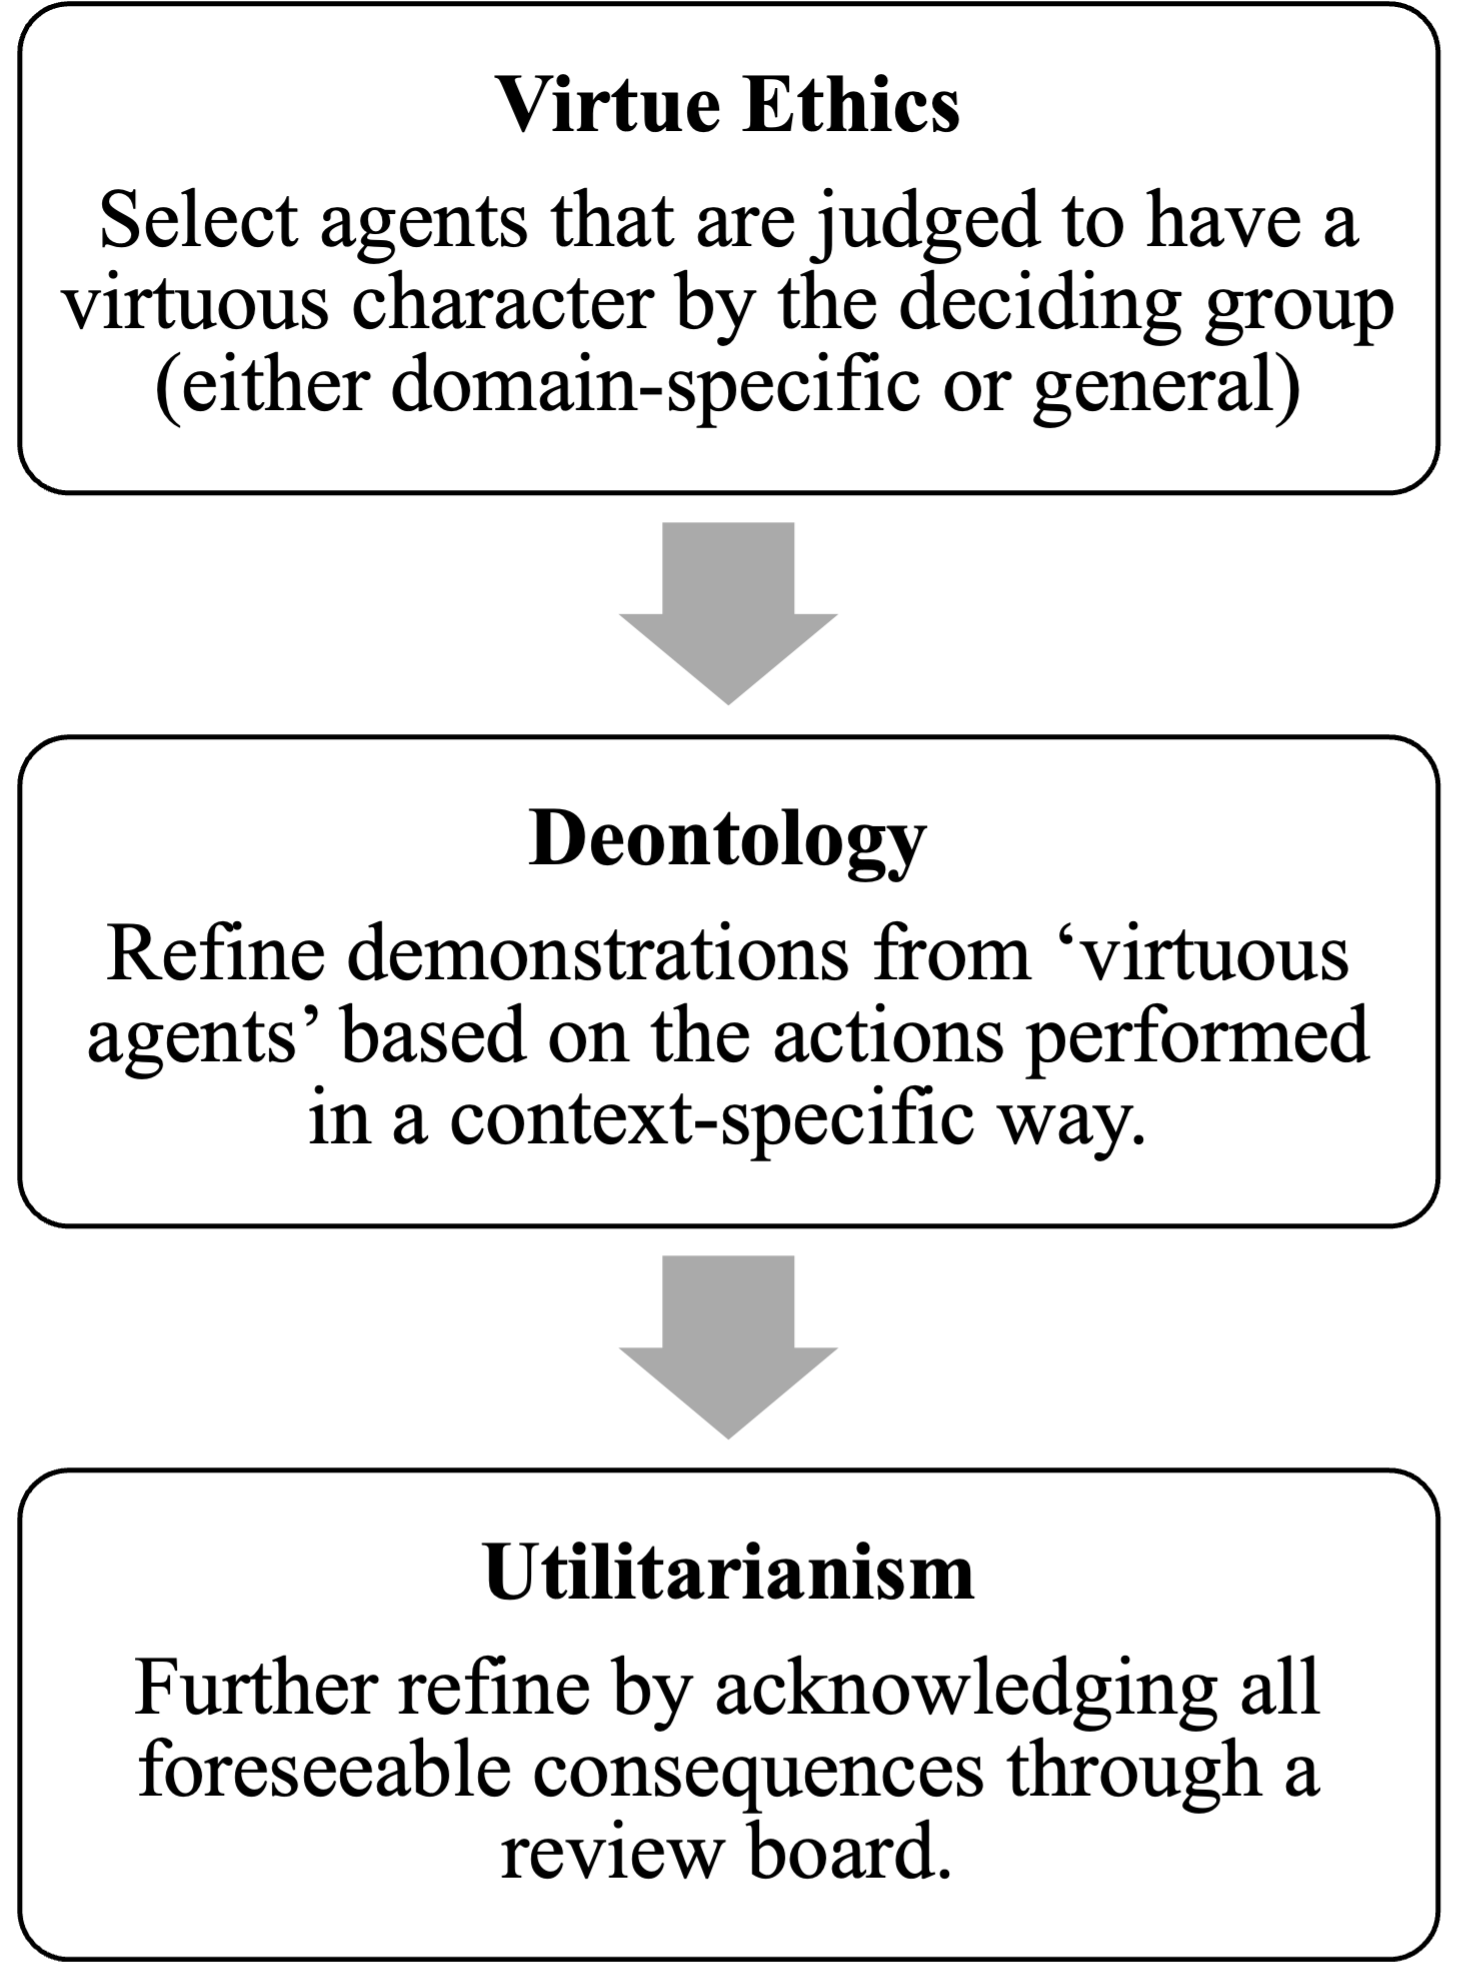
The image depicts a flowchart illustrating a three-stage ethical decision-making process, moving from Virtue Ethics to Deontology and finally to Utilitarianism. Each stage is represented by a rounded rectangle with descriptive text, and arrows indicate the flow of the process.
### Components/Axes
The diagram consists of three main components, arranged vertically:
1. **Virtue Ethics:** Top rectangle.
2. **Deontology:** Middle rectangle.
3. **Utilitarianism:** Bottom rectangle.
Arrows connect each stage, indicating the progression of the process.
### Content Details
**Stage 1: Virtue Ethics**
* **Label:** "Virtue Ethics" (centered at the top of the rectangle)
* **Text:** "Select agents that are judged to have a virtuous character by the deciding group (either domain-specific or general)"
**Stage 2: Deontology**
* **Label:** "Deontology" (centered at the top of the rectangle)
* **Text:** "Refine demonstrations from ‘virtuous agents’ based on the actions performed in a context-specific way."
**Stage 3: Utilitarianism**
* **Label:** "Utilitarianism" (centered at the top of the rectangle)
* **Text:** "Further refine by acknowledging all foreseeable consequence through a review board."
The arrows between each stage are gray and point downwards, indicating a sequential flow.
### Key Observations
The diagram presents a linear, sequential process. Each stage builds upon the previous one, refining the ethical considerations. The use of specific ethical frameworks (Virtue Ethics, Deontology, Utilitarianism) suggests a structured approach to ethical decision-making.
### Interpretation
This diagram illustrates a hierarchical approach to ethical decision-making. It begins with identifying individuals perceived as virtuous (Virtue Ethics), then evaluates their actions within a specific context (Deontology), and finally considers the broader consequences of those actions (Utilitarianism). The process suggests a move from subjective judgment (virtue) to objective rules (deontology) and finally to a consequentialist evaluation (utilitarianism). The inclusion of a "deciding group" and a "review board" indicates that this process is intended for use within an organizational or institutional setting. The diagram doesn't provide data or numerical values; it's a conceptual model of a process. It's a visual representation of a methodology, not a presentation of findings.