## Diagram and Chart: High-Precision Unit and Accuracy vs. Training Epoch
### Overview
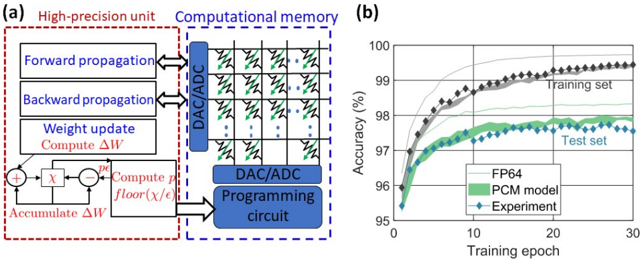
The image consists of two parts: (a) a diagram illustrating the architecture of a high-precision unit connected to computational memory, and (b) a chart showing the accuracy of different models (FP64, PCM model, and Experiment) over training epochs.
### Components/Axes
#### Part (a): Diagram of High-Precision Unit and Computational Memory
* **Title:** (a) High-precision unit Computational memory
* **Regions:**
* **High-precision unit:** Enclosed in a red dashed rectangle. Contains the following components:
* Forward propagation (blue text)
* Backward propagation (blue text)
* Weight update (red text): Compute ΔW
* Mathematical operations: A series of interconnected symbols representing addition (+), multiplication (X), and subtraction (-). The operations are labeled as "Compute p floor(χ/ε)" (red text) and "Accumulate ΔW" (red text).
* **Computational memory:** Enclosed in a blue dashed rectangle. Contains the following components:
* DAC/ADC (Digital-to-Analog Converter/Analog-to-Digital Converter) (blue text)
* Memory array: A grid-like structure with symbols resembling resistors or memory cells.
* DAC/ADC (Digital-to-Analog Converter/Analog-to-Digital Converter) (blue text)
* Programming circuit (blue text)
* **Flow:** Arrows indicate the flow of data and control signals between the high-precision unit and the computational memory.
#### Part (b): Accuracy vs. Training Epoch Chart
* **Title:** (b)
* **Axes:**
* X-axis: Training epoch (labeled from 0 to 30 in increments of 10)
* Y-axis: Accuracy (%) (labeled from 95 to 100 in increments of 1)
* **Legend:** Located in the bottom-right corner of the chart.
* FP64 (light gray line)
* PCM model (green shaded region)
* Experiment (blue line with diamond markers)
* **Data Series:**
* Training set (black line with diamond markers): Located near the top of the chart.
* Test set (blue text): Located near the middle of the chart.
### Detailed Analysis
#### Part (a): Diagram
The diagram illustrates a system where a high-precision unit interacts with computational memory. The high-precision unit performs forward and backward propagation, updates weights, and performs mathematical operations. The computational memory stores data and is controlled by a programming circuit. DAC/ADC converters facilitate communication between the analog memory and the digital processing unit.
#### Part (b): Chart
* **FP64 (light gray line):** The accuracy starts at approximately 95.8% at epoch 0 and increases rapidly, reaching approximately 99.5% by epoch 10. It then plateaus and remains relatively constant until epoch 30.
* **PCM model (green shaded region):** The accuracy starts at approximately 95.5% at epoch 0 and increases, reaching approximately 97.8% by epoch 15. It then fluctuates slightly around this value until epoch 30. The shaded region indicates the variability or uncertainty in the PCM model's accuracy.
* **Experiment (blue line with diamond markers):** The accuracy starts at approximately 95.3% at epoch 0 and increases, reaching approximately 97.3% by epoch 15. It then fluctuates slightly around this value until epoch 30.
* **Training set (black line with diamond markers):** The accuracy starts at approximately 95.8% at epoch 0 and increases rapidly, reaching approximately 98.5% by epoch 10. It then increases slowly, reaching approximately 99.5% by epoch 30.
### Key Observations
* The FP64 model achieves the highest accuracy, followed by the training set.
* The PCM model and the Experiment data have similar accuracy trends, with the Experiment data showing slightly lower accuracy.
* All models show a rapid increase in accuracy during the initial training epochs, followed by a plateau or slower increase.
### Interpretation
The diagram in part (a) illustrates the hardware architecture used for the experiment. The chart in part (b) demonstrates the performance of different models in terms of accuracy over training epochs. The FP64 model serves as a benchmark, achieving the highest accuracy. The PCM model and the Experiment data represent alternative approaches, with the Experiment data likely representing the actual hardware implementation. The results suggest that the PCM model and the Experiment data achieve comparable accuracy, but are lower than the FP64 model. The initial rapid increase in accuracy indicates that the models are learning effectively during the early stages of training. The subsequent plateau suggests that the models are approaching their maximum performance or that further training is needed to improve accuracy.