## Scatter Plot: Principal Component Analysis of Cognitive Task Categories
### Overview
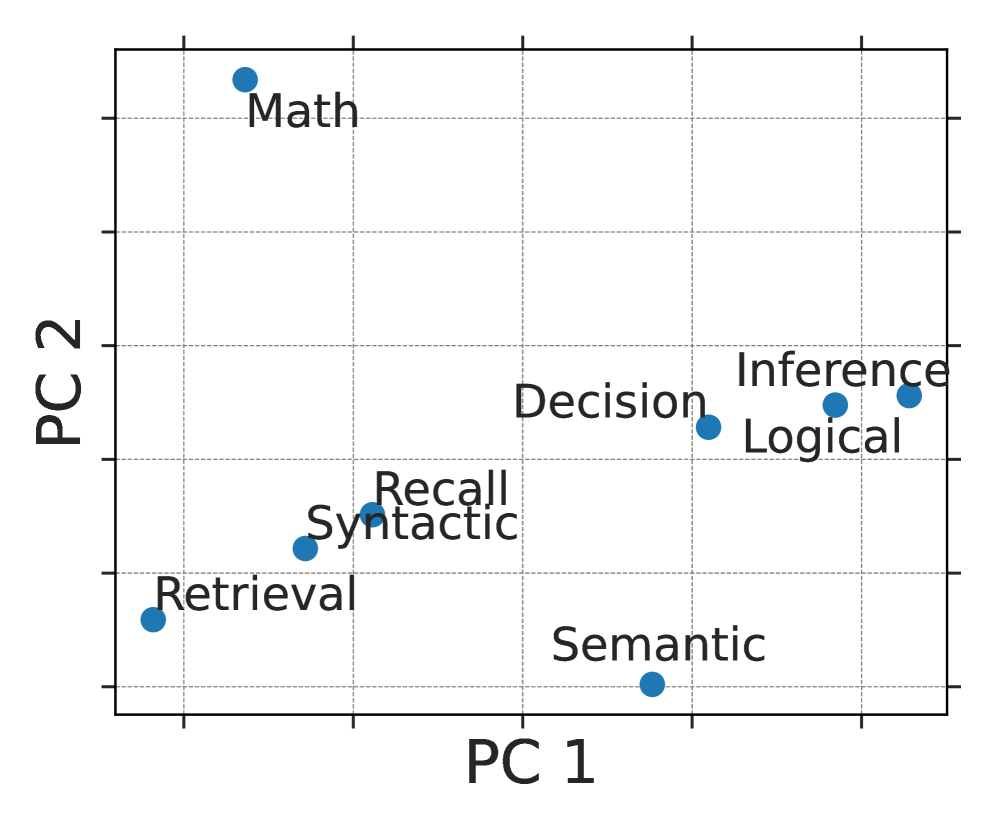
The image is a scatter plot visualizing the relationship between eight distinct cognitive task categories across two principal components (PC1 and PC2). The plot uses a standard Cartesian coordinate system with a grid. Each category is represented by a single blue data point with an adjacent text label. No numerical scales or values are provided on the axes, only relative positioning.
### Components/Axes
* **X-Axis (Horizontal):** Labeled "PC 1". Represents the first principal component. The axis has tick marks but no numerical values.
* **Y-Axis (Vertical):** Labeled "PC 2". Represents the second principal component. The axis has tick marks but no numerical values.
* **Data Series:** A single series of eight blue circular points. Each point is uniquely identified by a text label placed near it.
* **Legend:** There is no separate legend. Labels are placed directly adjacent to their corresponding data points.
### Detailed Analysis
**Spatial Grounding and Point Placement:**
The eight labeled points are distributed across the plot area. Their approximate relative positions are as follows:
1. **Math:** Located in the top-left quadrant. It is the highest point on the PC2 axis and is positioned far to the left on the PC1 axis.
2. **Retrieval:** Located in the bottom-left quadrant. It is the lowest point on the PC2 axis and is positioned far to the left on the PC1 axis.
3. **Syntactic:** Located in the left-center area, slightly above and to the right of "Retrieval".
4. **Recall:** Located very close to "Syntactic", slightly above and to the right of it.
5. **Semantic:** Located in the bottom-right quadrant. It is the lowest point on the PC2 axis on the right side and is positioned far to the right on the PC1 axis.
6. **Decision:** Located in the center-right area, above "Semantic".
7. **Logical:** Located in the top-right quadrant, to the right of "Decision".
8. **Inference:** Located in the top-right quadrant, to the right of and slightly above "Logical". It is the furthest point to the right on the PC1 axis.
**Clustering Observation:**
Visually, the points form two loose clusters:
* A **left-side cluster** containing Math, Retrieval, Syntactic, and Recall.
* A **right-side cluster** containing Semantic, Decision, Logical, and Inference.
### Key Observations
1. **Axis Separation:** The primary separation of data points occurs along the PC1 (horizontal) axis. The left cluster (Math, Retrieval, Syntactic, Recall) is distinctly separated from the right cluster (Semantic, Decision, Logical, Inference).
2. **PC2 Variation:** The PC2 (vertical) axis shows significant variation within clusters. "Math" is a clear outlier with a very high PC2 value. "Retrieval" and "Semantic" are outliers with very low PC2 values within their respective clusters.
3. **Tight Grouping:** The points "Syntactic" and "Recall" are positioned very close together, suggesting high similarity in their principal component scores. Similarly, "Logical" and "Inference" are close neighbors.
4. **No Numerical Data:** The chart provides no quantitative data. All analysis is based on the relative spatial positioning of the labeled points.
### Interpretation
This scatter plot likely results from a dimensionality reduction technique (like PCA) applied to a dataset where different cognitive tasks were measured across many variables. The plot suggests a fundamental underlying structure in how these tasks relate to each other.
* **PC1 as a Core Dimension:** The strong left-right separation along PC1 indicates this component captures the most significant variance in the data. The left cluster (Retrieval, Syntactic, Recall, Math) may represent tasks more associated with **memory, pattern recognition, and formal systems**. The right cluster (Semantic, Decision, Logical, Inference) may represent tasks more associated with **meaning, reasoning, and drawing conclusions**.
* **The Unique Position of Math:** "Math" is separated from the other left-cluster tasks by its high PC2 value. This suggests that while it shares some characteristics with retrieval/syntactic tasks (placing it on the left), it possesses a distinct quality captured by PC2 that sets it apart—perhaps related to abstraction, precision, or formal rule application.
* **Semantic as an Anchor:** "Semantic" knowledge is positioned low on PC2 but firmly in the right cluster. This could imply that semantic understanding is a foundational component (low on the abstract PC2 dimension) for the reasoning tasks (Decision, Logical, Inference) that cluster above it.
* **Proximity Implies Similarity:** The close proximity of "Syntactic" and "Recall" suggests these tasks are highly correlated in the analyzed dataset. Likewise, "Logical" and "Inference" are nearly overlapping, indicating they may be measuring very similar cognitive constructs in this context.
**In summary, the visualization argues that cognitive tasks can be mapped onto a latent space where a primary axis distinguishes between memory/pattern-based functions and meaning/reasoning-based functions, with mathematical reasoning occupying a unique, elevated position within the former category.**