## Heatmap: Sequential Number Grid with Color Gradient and Diagonal Streak
### Overview
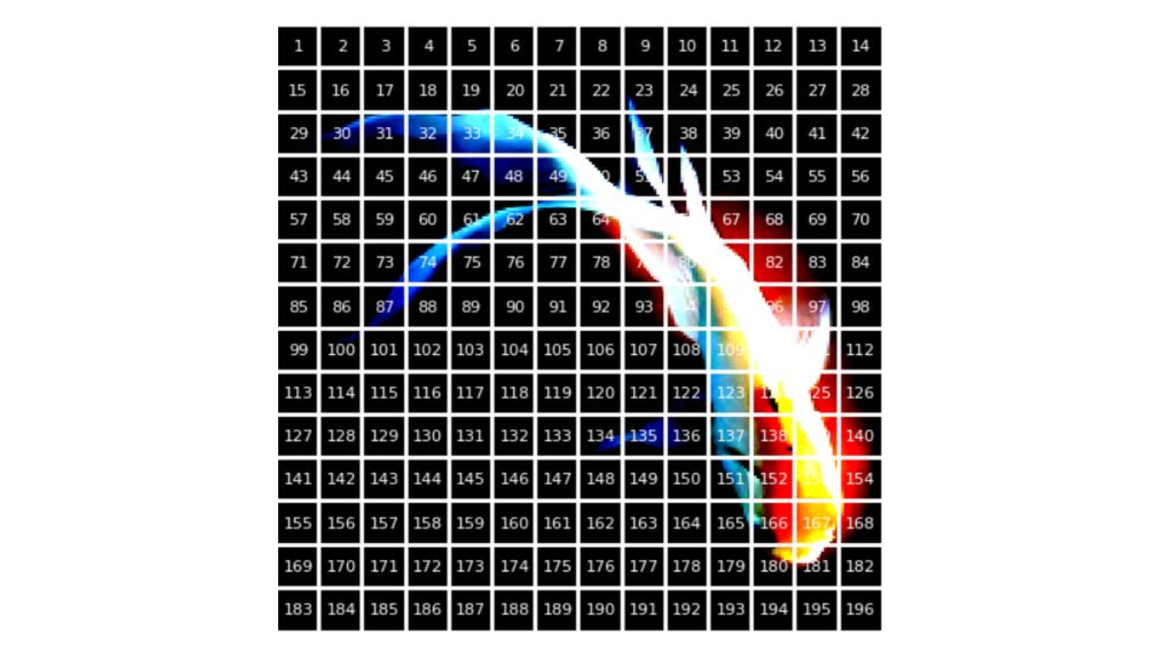
The image displays a 14x14 heatmap grid containing sequential numbers from 1 to 196. A prominent white diagonal streak spans from the top-left to bottom-right, overlaying the grid. The background features a blue-to-red gradient, with white representing the midpoint intensity.
### Components/Axes
- **X-axis (Top Row)**: Labeled 1 to 14, representing column indices.
- **Y-axis (Left Column)**: Labeled 1 to 14, representing row indices.
- **Grid Cells**: Each cell contains a sequential number (1–196), increasing left-to-right and top-to-bottom.
- **Color Gradient**:
- Blue (low values) → White (midpoint) → Red (high values).
- No explicit legend, but gradient implies value mapping.
- **White Streak**: Diagonal line from (1,1) to (14,14), overlaying cells with values 1, 16, 31, 46, 61, 76, 91, 106, 121, 136, 151, 166, 181, 196.
### Detailed Analysis
- **Grid Structure**:
- Rows and columns are numbered 1–14.
- Cell values follow a sequential pattern: Row 1 = 1–14, Row 2 = 15–28, ..., Row 14 = 183–196.
- **Color Intensity**:
- Blue cells (e.g., 1, 2, 3) represent the lowest values.
- Red cells (e.g., 183–196) represent the highest values.
- White streak cells (e.g., 1, 16, 31) are mid-range values (~50–150).
- **White Streak Placement**:
- Diagonal cells (i,i) where i = 1–14.
- Values on the streak: 1, 16, 31, 46, 61, 76, 91, 106, 121, 136, 151, 166, 181, 196.
- These values span the full range but cluster around the midpoint (98.5).
### Key Observations
1. **Diagonal Dominance**: The white streak highlights cells with values increasing by ~15 units per step (e.g., 1 → 16 → 31).
2. **Midpoint Concentration**: The streak’s white color suggests these cells represent mid-range values, though they span the entire spectrum.
3. **Sequential Pattern**: Numbers increase uniformly across rows and columns, with no apparent anomalies.
### Interpretation
- **Data Representation**: The heatmap visualizes a matrix where each cell’s value corresponds to its position in a 14x14 grid. The white streak emphasizes a diagonal subset, potentially indicating a focus on specific intervals (e.g., every 15th value).
- **Color Gradient**: The blue-to-red gradient provides a visual scale for value magnitude, with the white streak acting as a reference for mid-range data.
- **Anomalies**: No outliers detected; the sequential pattern is consistent. The white streak’s inclusion suggests intentional highlighting of the diagonal, possibly for analytical or illustrative purposes.