## Heatmap: Dataset Performance Comparison
### Overview
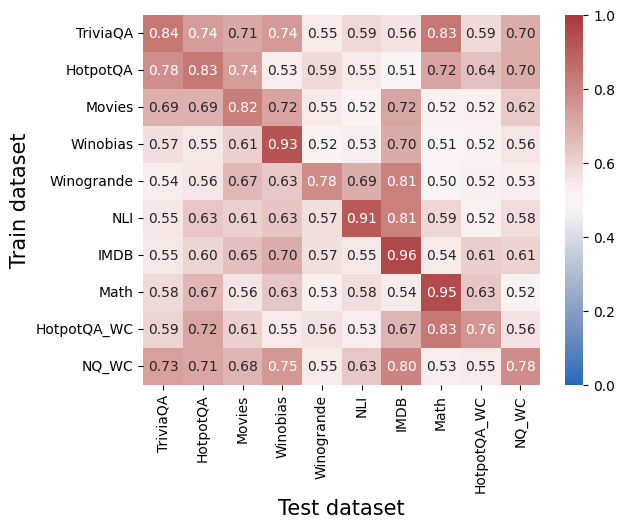
The image is a heatmap visualizing the performance of different datasets when used for training and testing. The rows represent the training datasets, the columns represent the testing datasets, and the color intensity indicates the performance score, ranging from 0.0 to 1.0.
### Components/Axes
* **X-axis (Test dataset):** Lists the datasets used for testing, including TriviaQA, HotpotQA, Movies, Winobias, Winogrande, NLI, IMDB, Math, HotpotQA\_WC, and NQ\_WC.
* **Y-axis (Train dataset):** Lists the datasets used for training, including TriviaQA, HotpotQA, Movies, Winobias, Winogrande, NLI, IMDB, Math, HotpotQA\_WC, and NQ\_WC.
* **Color Scale:** A vertical color bar on the right side of the heatmap, ranging from blue (0.0) to red (1.0), indicating the performance score.
### Detailed Analysis
The heatmap displays performance scores for each combination of training and testing datasets. The scores are represented by both color intensity and numerical values within each cell.
Here's a breakdown of the values:
* **TriviaQA:**
* Trained on TriviaQA: 0.84
* Trained on HotpotQA: 0.74
* Trained on Movies: 0.71
* Trained on Winobias: 0.74
* Trained on Winogrande: 0.55
* Trained on NLI: 0.59
* Trained on IMDB: 0.56
* Trained on Math: 0.83
* Trained on HotpotQA\_WC: 0.59
* Trained on NQ\_WC: 0.70
* **HotpotQA:**
* Trained on TriviaQA: 0.78
* Trained on HotpotQA: 0.83
* Trained on Movies: 0.74
* Trained on Winobias: 0.53
* Trained on Winogrande: 0.59
* Trained on NLI: 0.55
* Trained on IMDB: 0.51
* Trained on Math: 0.72
* Trained on HotpotQA\_WC: 0.64
* Trained on NQ\_WC: 0.70
* **Movies:**
* Trained on TriviaQA: 0.69
* Trained on HotpotQA: 0.69
* Trained on Movies: 0.82
* Trained on Winobias: 0.72
* Trained on Winogrande: 0.55
* Trained on NLI: 0.52
* Trained on IMDB: 0.72
* Trained on Math: 0.52
* Trained on HotpotQA\_WC: 0.52
* Trained on NQ\_WC: 0.62
* **Winobias:**
* Trained on TriviaQA: 0.57
* Trained on HotpotQA: 0.55
* Trained on Movies: 0.61
* Trained on Winobias: 0.93
* Trained on Winogrande: 0.52
* Trained on NLI: 0.53
* Trained on IMDB: 0.70
* Trained on Math: 0.51
* Trained on HotpotQA\_WC: 0.52
* Trained on NQ\_WC: 0.56
* **Winogrande:**
* Trained on TriviaQA: 0.54
* Trained on HotpotQA: 0.56
* Trained on Movies: 0.67
* Trained on Winobias: 0.63
* Trained on Winogrande: 0.78
* Trained on NLI: 0.69
* Trained on IMDB: 0.81
* Trained on Math: 0.50
* Trained on HotpotQA\_WC: 0.52
* Trained on NQ\_WC: 0.53
* **NLI:**
* Trained on TriviaQA: 0.55
* Trained on HotpotQA: 0.63
* Trained on Movies: 0.61
* Trained on Winobias: 0.63
* Trained on Winogrande: 0.57
* Trained on NLI: 0.91
* Trained on IMDB: 0.81
* Trained on Math: 0.59
* Trained on HotpotQA\_WC: 0.52
* Trained on NQ\_WC: 0.58
* **IMDB:**
* Trained on TriviaQA: 0.55
* Trained on HotpotQA: 0.60
* Trained on Movies: 0.65
* Trained on Winobias: 0.70
* Trained on Winogrande: 0.57
* Trained on NLI: 0.55
* Trained on IMDB: 0.96
* Trained on Math: 0.54
* Trained on HotpotQA\_WC: 0.61
* Trained on NQ\_WC: 0.61
* **Math:**
* Trained on TriviaQA: 0.58
* Trained on HotpotQA: 0.67
* Trained on Movies: 0.56
* Trained on Winobias: 0.63
* Trained on Winogrande: 0.53
* Trained on NLI: 0.58
* Trained on IMDB: 0.54
* Trained on Math: 0.95
* Trained on HotpotQA\_WC: 0.63
* Trained on NQ\_WC: 0.52
* **HotpotQA\_WC:**
* Trained on TriviaQA: 0.59
* Trained on HotpotQA: 0.72
* Trained on Movies: 0.61
* Trained on Winobias: 0.55
* Trained on Winogrande: 0.56
* Trained on NLI: 0.53
* Trained on IMDB: 0.67
* Trained on Math: 0.83
* Trained on HotpotQA\_WC: 0.76
* Trained on NQ\_WC: 0.56
* **NQ\_WC:**
* Trained on TriviaQA: 0.73
* Trained on HotpotQA: 0.71
* Trained on Movies: 0.68
* Trained on Winobias: 0.75
* Trained on Winogrande: 0.55
* Trained on NLI: 0.63
* Trained on IMDB: 0.80
* Trained on Math: 0.53
* Trained on HotpotQA\_WC: 0.55
* Trained on NQ\_WC: 0.78
### Key Observations
* The diagonal elements (training and testing on the same dataset) generally have higher scores, indicating that models perform best when tested on data similar to what they were trained on.
* IMDB and NLI datasets show high performance when trained and tested on themselves.
* Winobias dataset shows high performance when trained and tested on itself.
* Math dataset shows high performance when trained and tested on itself.
* The performance varies significantly depending on the combination of training and testing datasets.
### Interpretation
The heatmap illustrates the transferability of knowledge between different datasets. High scores along the diagonal suggest that models are well-suited for their native datasets. Off-diagonal scores indicate how well a model trained on one dataset generalizes to another. The variations in performance highlight the differences in the nature and complexity of the datasets. For example, training on IMDB and testing on other datasets often results in lower performance, suggesting that IMDB data may have unique characteristics that don't generalize well. The heatmap can be used to inform decisions about dataset selection for training and testing machine learning models.