\n
## Heatmap: Cross-Dataset Generalization Performance
### Overview
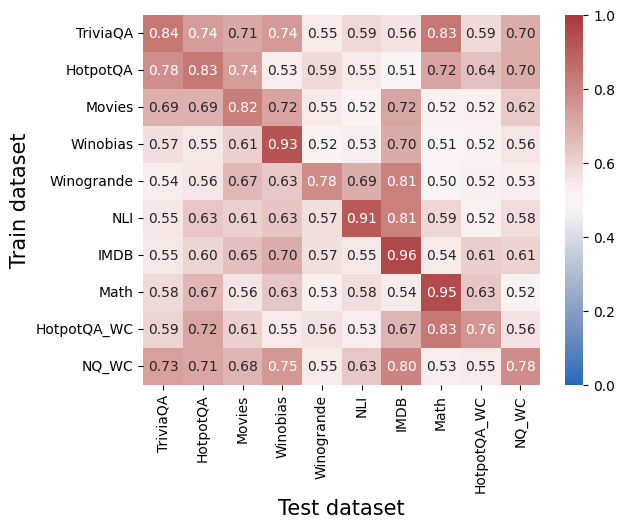
This image presents a heatmap visualizing the cross-dataset generalization performance of a model. The heatmap displays the correlation between performance on different training datasets (rows) and different test datasets (columns). The color intensity represents the correlation coefficient, ranging from 0.0 to 1.0, with darker shades of red indicating higher correlation and blue indicating lower correlation.
### Components/Axes
* **X-axis (Horizontal):** Test dataset. Categories are: TriviaQA, HotpotQA, Movies, Winobias, Winogrande, NLI, IMDB, Math, HotpotQA\_WC, NQ\_WC.
* **Y-axis (Vertical):** Train dataset. Categories are: TriviaQA, HotpotQA, Movies, Winobias, Winogrande, NLI, IMDB, Math, HotpotQA\_WC, NQ\_WC.
* **Color Scale (Legend):** Located on the right side of the heatmap. Ranges from 0.0 (blue) to 1.0 (red). The scale is marked with values 0.0, 0.2, 0.4, 0.6, 0.8, and 1.0.
* **Labels:** Each cell in the heatmap contains a numerical value representing the correlation coefficient.
### Detailed Analysis
The heatmap shows the correlation coefficients between training and testing on different datasets. I will analyze row by row, noting trends and specific values.
* **TriviaQA (Row 1):** The diagonal value is 0.84. Performance is relatively high when trained and tested on TriviaQA. Correlation decreases with other datasets, ranging from approximately 0.55 (Winogrande) to 0.74 (HotpotQA).
* **HotpotQA (Row 2):** Diagonal value is 0.78. Similar to TriviaQA, performance is best when trained and tested on HotpotQA. Correlation values range from 0.53 (Winogrande) to 0.83 (TriviaQA).
* **Movies (Row 3):** Diagonal value is 0.69. Performance is moderate when trained and tested on Movies. Correlation values range from 0.52 (Winogrande) to 0.82 (HotpotQA).
* **Winobias (Row 4):** Diagonal value is 0.93. This dataset shows the highest self-correlation. Performance is relatively low when tested on other datasets, ranging from 0.52 (Winogrande) to 0.57 (TriviaQA).
* **Winogrande (Row 5):** Diagonal value is 0.78. Performance is moderate when trained and tested on Winogrande. Correlation values range from 0.52 (HotpotQA\_WC) to 0.69 (NLI).
* **NLI (Row 6):** Diagonal value is 0.91. High self-correlation. Performance is relatively low when tested on other datasets, ranging from 0.52 (HotpotQA\_WC) to 0.57 (TriviaQA).
* **IMDB (Row 7):** Diagonal value is 0.96. Highest self-correlation. Performance is relatively low when tested on other datasets, ranging from 0.54 (Math) to 0.61 (Movies).
* **Math (Row 8):** Diagonal value is 0.95. High self-correlation. Performance is relatively low when tested on other datasets, ranging from 0.52 (NQ\_WC) to 0.67 (HotpotQA).
* **HotpotQA\_WC (Row 9):** Diagonal value is 0.76. Performance is moderate when trained and tested on HotpotQA\_WC. Correlation values range from 0.53 (NLI) to 0.72 (HotpotQA).
* **NQ\_WC (Row 10):** Diagonal value is 0.78. Performance is moderate when trained and tested on NQ\_WC. Correlation values range from 0.55 (Math) to 0.73 (TriviaQA).
### Key Observations
* **High Self-Correlation:** Datasets Winobias, NLI, and IMDB exhibit very high correlation when trained and tested on themselves (diagonal values close to 1.0). This suggests the model performs well when evaluated on data similar to what it was trained on.
* **Low Cross-Dataset Correlation:** Generally, the correlation coefficients are lower when the test dataset differs from the training dataset. This indicates that models trained on one dataset do not generalize well to other datasets.
* **Winobias and NLI Generalization:** Winobias and NLI show particularly low correlation with most other datasets, suggesting they are very specific and do not transfer well to other tasks.
* **TriviaQA and HotpotQA:** These datasets show relatively higher correlation with each other, suggesting some overlap in the types of questions or knowledge required.
### Interpretation
The heatmap demonstrates the challenge of cross-dataset generalization in question answering and natural language inference. Models trained on one dataset tend to perform poorly on others, even within the same general domain. This suggests that datasets differ significantly in their characteristics, such as question types, knowledge requirements, and data distribution. The high self-correlation indicates that models can achieve high performance when evaluated on data similar to their training data, but their ability to generalize to new datasets is limited.
The low correlation between Winobias/NLI and other datasets suggests these datasets may focus on very specific linguistic phenomena or require specialized reasoning skills. The relatively higher correlation between TriviaQA and HotpotQA suggests they share some common characteristics, making it easier for a model trained on one to generalize to the other.
This data highlights the need for more robust models that can generalize across datasets and the importance of carefully considering the characteristics of the training data when evaluating model performance. Further investigation into the specific differences between these datasets could help develop strategies for improving cross-dataset generalization.