## Heatmap: Correlation Between Train and Test Datasets
### Overview
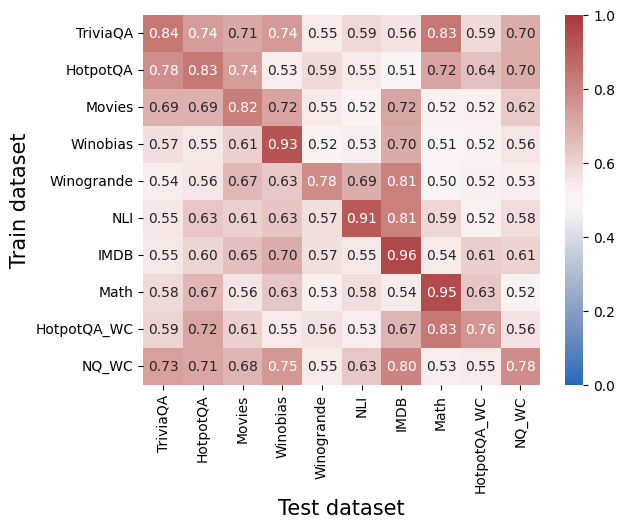
The image is a heatmap visualizing correlation values between pairs of datasets used for training and testing machine learning models. The color intensity (from blue to red) represents correlation strength, with darker red indicating higher correlation (closer to 1.0) and lighter blue indicating lower correlation (closer to 0.0). The dataset names are listed on both axes, with train datasets on the y-axis and test datasets on the x-axis.
### Components/Axes
- **X-axis (Test datasets)**: TriviaQA, HotpotQA, Movies, Winobias, Winogrande, NLI, IMDB, Math, HotpotQA_WC, NQ_WC
- **Y-axis (Train datasets)**: Same as X-axis (TriviaQA, HotpotQA, ..., NQ_WC)
- **Legend**: Color bar on the right, ranging from 0.0 (blue) to 1.0 (red), labeled "Correlation"
- **Axis titles**:
- X-axis: "Test dataset"
- Y-axis: "Train dataset"
### Detailed Analysis
- **Diagonal values** (same train/test dataset pairs):
- TriviaQA: 0.84
- HotpotQA: 0.78
- Movies: 0.69
- Winobias: 0.93
- Winogrande: 0.54
- NLI: 0.55
- IMDB: 0.55
- Math: 0.58
- HotpotQA_WC: 0.59
- NQ_WC: 0.73
- **Notable off-diagonal values**:
- **High correlations**:
- IMDb (train) ↔ IMDb (test): 0.96
- Math (train) ↔ Math (test): 0.95
- Winobias (train) ↔ Winobias (test): 0.93
- NQ_WC (train) ↔ NQ_WC (test): 0.78
- **Low correlations**:
- Movies (train) ↔ Winobias (test): 0.52
- Winogrande (train) ↔ Math (test): 0.50
- HotpotQA (train) ↔ NLI (test): 0.55
### Key Observations
1. **Diagonal dominance**: All train/test pairs with identical datasets show high correlation (0.54–0.96), confirming that models trained on a dataset perform best on the same test set.
2. **Cross-dataset variability**:
- IMDb and Math show strong cross-correlations with other datasets (e.g., IMDb ↔ HotpotQA_WC: 0.67).
- Winobias and Winogrande exhibit lower cross-correlations (e.g., Winobias ↔ Winogrande: 0.67).
3. **Outliers**:
- Movies ↔ Winobias (0.52) and Winogrande ↔ Math (0.50) are among the weakest correlations.
- NLI ↔ NLI (0.57) and IMDb ↔ IMDb (0.96) highlight dataset-specific performance gaps.
### Interpretation
The heatmap reveals that dataset-specific training significantly impacts performance, as evidenced by high diagonal values. Cross-dataset correlations vary widely, suggesting that some datasets (e.g., IMDb, Math) share structural or linguistic features that generalize better across tasks, while others (e.g., Movies, Winobias) are more domain-specific. The weakest correlations (e.g., Movies ↔ Winobias) imply that models trained on these datasets may struggle to adapt to dissimilar test sets, highlighting the importance of dataset diversity in training for robust generalization. The color gradient visually reinforces these trends, with red dominating the diagonal and cooler tones appearing in off-diagonal cells with lower values.