## Line Chart: Benchmark Length vs. Number of Failed LLMs
### Overview
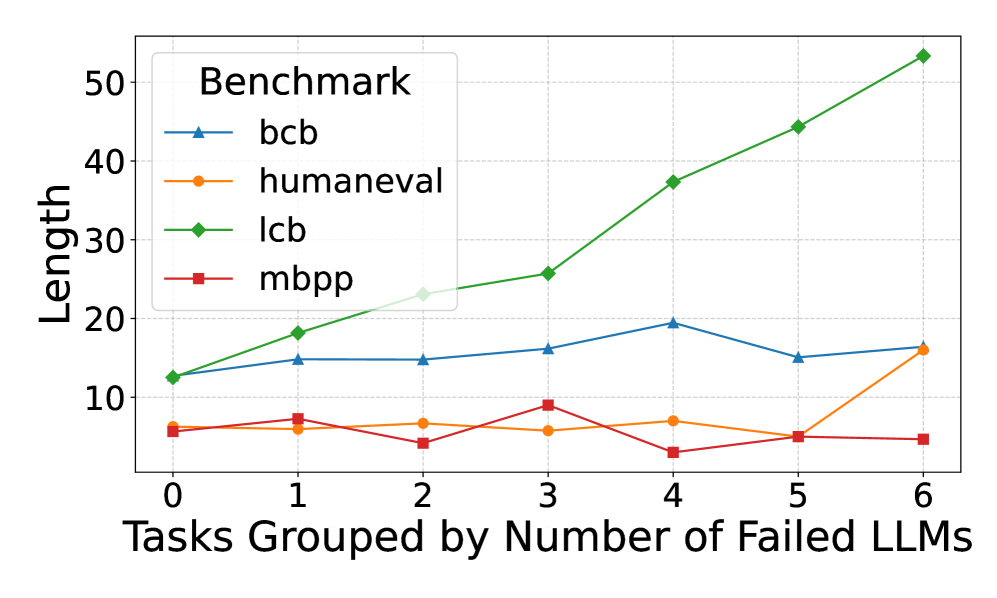
The image is a line chart comparing the length of different benchmarks (bcb, humaneval, lcb, mbpp) against the number of failed Large Language Models (LLMs). The x-axis represents the number of failed LLMs, ranging from 0 to 6. The y-axis represents the length of the benchmark.
### Components/Axes
* **Title:** Benchmark (located in the top-left corner within the legend)
* **X-axis Title:** Tasks Grouped by Number of Failed LLMs
* **X-axis Markers:** 0, 1, 2, 3, 4, 5, 6
* **Y-axis Title:** Length
* **Y-axis Markers:** 10, 20, 30, 40, 50
* **Legend:** Located in the top-left corner.
* **bcb:** Blue line with triangle markers
* **humaneval:** Orange line with circle markers
* **lcb:** Green line with diamond markers
* **mbpp:** Red line with square markers
### Detailed Analysis
* **bcb (Blue, Triangle):** The line starts at approximately 12 at 0 failed LLMs, increases to approximately 15 at 1 failed LLMs, remains relatively stable at approximately 14 at 2 failed LLMs, increases to approximately 16 at 3 failed LLMs, peaks at approximately 19 at 4 failed LLMs, decreases to approximately 14 at 5 failed LLMs, and ends at approximately 15 at 6 failed LLMs.
* **humaneval (Orange, Circle):** The line starts at approximately 6 at 0 failed LLMs, increases to approximately 7 at 1 failed LLMs, decreases to approximately 6 at 2 failed LLMs, increases to approximately 8 at 3 failed LLMs, decreases to approximately 7 at 4 failed LLMs, decreases to approximately 5 at 5 failed LLMs, and increases to approximately 16 at 6 failed LLMs.
* **lcb (Green, Diamond):** The line starts at approximately 12 at 0 failed LLMs, increases to approximately 18 at 1 failed LLMs, increases to approximately 23 at 2 failed LLMs, increases to approximately 26 at 3 failed LLMs, increases to approximately 38 at 4 failed LLMs, increases to approximately 45 at 5 failed LLMs, and increases to approximately 53 at 6 failed LLMs.
* **mbpp (Red, Square):** The line starts at approximately 6 at 0 failed LLMs, increases to approximately 7 at 1 failed LLMs, decreases to approximately 4 at 2 failed LLMs, increases to approximately 9 at 3 failed LLMs, decreases to approximately 3 at 4 failed LLMs, increases to approximately 5 at 5 failed LLMs, and remains relatively stable at approximately 5 at 6 failed LLMs.
### Key Observations
* The 'lcb' benchmark shows a consistently increasing length as the number of failed LLMs increases.
* The 'bcb' benchmark shows a relatively stable length, with a slight peak at 4 failed LLMs.
* The 'humaneval' and 'mbpp' benchmarks show more fluctuation in length, with 'humaneval' spiking at 6 failed LLMs.
### Interpretation
The chart suggests that the length of the 'lcb' benchmark is positively correlated with the number of failed LLMs. This could indicate that tasks in the 'lcb' benchmark become more complex or require longer solutions as more LLMs fail to solve them. The other benchmarks do not show a clear trend, suggesting that their length is not as strongly influenced by the number of failed LLMs. The spike in 'humaneval' at 6 failed LLMs could indicate a specific task or set of tasks that are particularly challenging for LLMs.