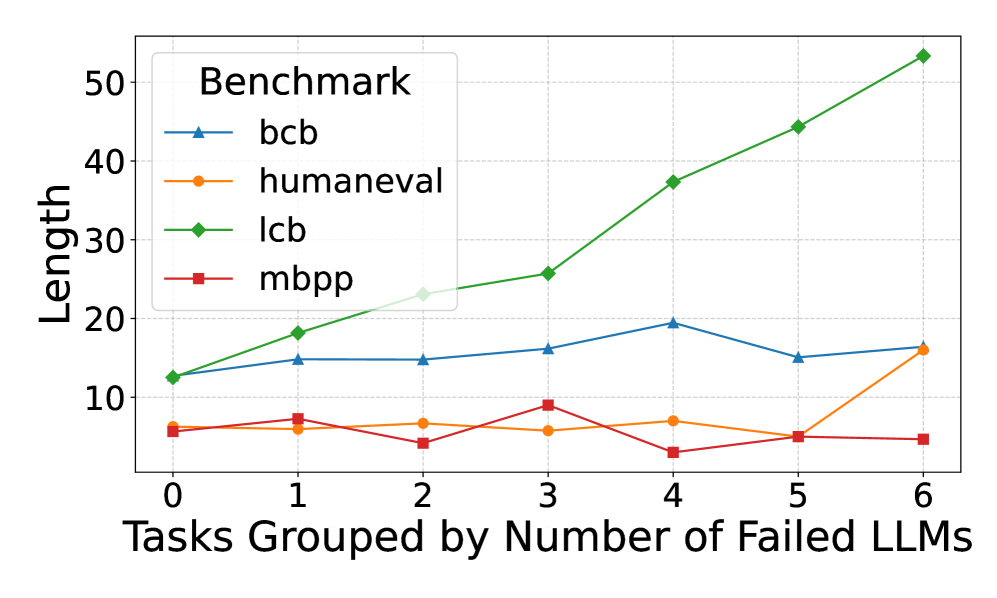
## Line Chart: Benchmark Performance by Task Group
### Overview
The chart illustrates the relationship between task groups (grouped by the number of failed LLMs) and the "Length" metric across four benchmarks: bcb, humaneval, lcb, and mbpp. The x-axis represents task groups (0–6), and the y-axis represents "Length" (0–50). Each benchmark is represented by a distinct line with unique markers and colors.
### Components/Axes
- **Title**: "Benchmark" (top-left corner).
- **X-axis**: "Tasks Grouped by Number of Failed LLMs" (0–6, integer increments).
- **Y-axis**: "Length" (0–50, linear scale).
- **Legend**: Located in the top-left corner, mapping:
- **bcb**: Blue line with triangle markers.
- **humaneval**: Orange line with circle markers.
- **lcb**: Green line with diamond markers.
- **mbpp**: Red line with square markers.
### Detailed Analysis
1. **lcb (Green Line)**:
- **Trend**: Steadily increases from ~12 (x=0) to ~53 (x=6).
- **Key Points**:
- x=0: ~12
- x=1: ~18
- x=2: ~23
- x=3: ~26
- x=4: ~37
- x=5: ~44
- x=6: ~53
- **Observation**: Strong positive correlation between task group and length.
2. **bcb (Blue Line)**:
- **Trend**: Fluctuates with a peak at x=4 (~20) and a dip at x=5 (~15).
- **Key Points**:
- x=0: ~12
- x=1: ~14
- x=2: ~14
- x=3: ~15
- x=4: ~20
- x=5: ~15
- x=6: ~16
- **Observation**: Moderate variability, with a notable peak at x=4.
3. **humaneval (Orange Line)**:
- **Trend**: Relatively flat with minor fluctuations.
- **Key Points**:
- x=0: ~7
- x=1: ~6
- x=2: ~7
- x=3: ~6
- x=4: ~8
- x=5: ~6
- x=6: ~16
- **Observation**: Sharp increase at x=6, otherwise stable.
4. **mbpp (Red Line)**:
- **Trend**: Slightly variable with a peak at x=3 (~9) and a dip at x=4 (~4).
- **Key Points**:
- x=0: ~6
- x=1: ~8
- x=2: ~5
- x=3: ~9
- x=4: ~4
- x=5: ~6
- x=6: ~5
- **Observation**: High variability, with a significant dip at x=4.
### Key Observations
- **lcb** exhibits the most pronounced growth, suggesting it is highly sensitive to the number of failed LLMs.
- **bcb** and **mbpp** show moderate variability, with bcb peaking at x=4 and mbpp peaking at x=3.
- **humaneval** remains relatively stable until x=6, where it spikes sharply.
- All benchmarks start with similar lengths at x=0 (~6–12), but diverge significantly by x=6.
### Interpretation
The data suggests that **lcb** is the most responsive to increases in failed LLMs, with its length growing exponentially as task groups expand. This could indicate that lcb is designed to handle larger or more complex tasks as failures increase. In contrast, **humaneval** and **mbpp** show less sensitivity, with humaneval’s sharp rise at x=6 potentially reflecting a threshold effect. The variability in bcb and mbpp may reflect differing task complexities or evaluation criteria. The chart highlights the importance of benchmark design in capturing task-specific performance trends, particularly in scenarios with high failure rates.