\n
## Diagram: Activity and Outcome Relationships
### Overview
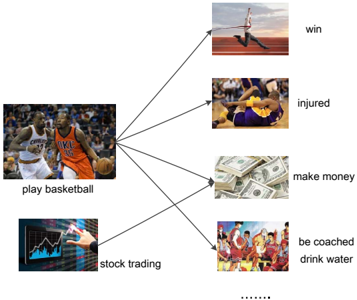
The image is a diagram illustrating potential outcomes or consequences associated with two primary activities: playing basketball and stock trading. The diagram uses images to represent both the activities and their respective outcomes, connected by arrows indicating a relationship. The diagram is visually simple, focusing on direct associations rather than complex interactions.
### Components/Axes
The diagram consists of the following components:
* **Activity 1:** "play basketball" - represented by an image of two basketball players in uniform during a game.
* **Activity 2:** "stock trading" - represented by an image of a person interacting with stock market charts on a screen.
* **Outcomes of "play basketball":**
* "win" - represented by an image of a runner being pulled across a finish line by a red cord.
* "injured" - represented by an image of a basketball player lying on the court, seemingly injured.
* "make money" - represented by an image of stacks of US dollar bills.
* "be coached" / "drink water" - represented by an image of a basketball team with a coach.
* **Arrows:** Lines connecting each activity to its associated outcomes.
### Detailed Analysis or Content Details
The diagram shows a one-to-many relationship between activities and outcomes.
* **"play basketball"** is connected to four outcomes: "win", "injured", "make money", and "be coached/drink water".
* **"stock trading"** is not connected to any outcomes in the visible portion of the diagram, indicated by the "..." symbol.
The image does not provide any quantitative data or specific probabilities associated with these outcomes. It simply illustrates potential associations.
### Key Observations
The diagram presents a somewhat simplified view of the relationship between activities and outcomes. It suggests that playing basketball can lead to both positive outcomes (winning, making money) and negative outcomes (injury). The inclusion of "be coached/drink water" as an outcome is less direct than the others, representing supporting activities or necessities. The diagram implies that stock trading also has outcomes, but these are not shown.
### Interpretation
The diagram appears to be a conceptual illustration of risk and reward associated with different activities. Playing basketball is presented as an activity with a range of potential outcomes, both desirable and undesirable. The diagram highlights the inherent uncertainties involved in both activities. The lack of visible outcomes for stock trading suggests either that the outcomes are more complex or that the diagram is incomplete. The diagram could be used to initiate a discussion about the potential benefits and drawbacks of different choices. The image is a visual metaphor for the idea that every action has consequences, and those consequences can be both positive and negative. The image does not provide any facts or data, but rather a conceptual representation of potential relationships.