## Line Chart: Answer Accuracy Across Layers for Mistral-7B Models (v0.1 and v0.3)
### Overview
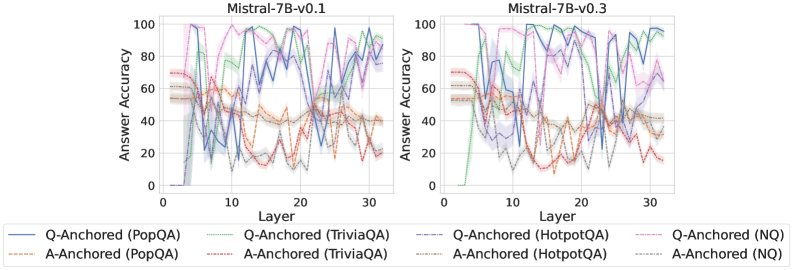
The image contains two line charts comparing answer accuracy across 30 layers of the Mistral-7B model (versions v0.1 and v0.3). Each chart displays multiple data series representing different question-answering (QA) datasets and anchoring methods (Q-Anchored vs. A-Anchored). The y-axis measures answer accuracy (0–100%), while the x-axis represents model layers (0–30). The charts highlight variability in performance across layers and datasets.
---
### Components/Axes
- **X-axis (Layer)**: Labeled "Layer" with ticks at 0, 10, 20, 30.
- **Y-axis (Answer Accuracy)**: Labeled "Answer Accuracy" with ticks at 0, 20, 40, 60, 80, 100.
- **Legends**:
- **Left Chart (v0.1)**:
- Solid lines: Q-Anchored (PopQA, TriviaQA, HotpotQA, NQ).
- Dashed lines: A-Anchored (PopQA, TriviaQA, HotpotQA, NQ).
- **Right Chart (v0.3)**:
- Solid lines: Q-Anchored (PopQA, TriviaQA, HotpotQA, NQ).
- Dashed lines: A-Anchored (PopQA, TriviaQA, HotpotQA, NQ).
- **Titles**:
- Left: "Mistral-7B-v0.1"
- Right: "Mistral-7B-v0.3"
---
### Detailed Analysis
#### Left Chart (Mistral-7B-v0.1)
- **Q-Anchored (PopQA)**: Starts at ~80% accuracy, dips to ~40% at layer 10, then fluctuates between ~50–70% (peak ~75% at layer 20).
- **A-Anchored (PopQA)**: Starts at ~60%, dips to ~30% at layer 10, then stabilizes around ~40–50%.
- **Q-Anchored (TriviaQA)**: Peaks at ~90% at layer 5, drops to ~30% at layer 15, then recovers to ~70% at layer 30.
- **A-Anchored (TriviaQA)**: Starts at ~50%, dips to ~20% at layer 10, then fluctuates between ~30–50%.
- **Q-Anchored (HotpotQA)**: Peaks at ~85% at layer 10, drops to ~40% at layer 20, then recovers to ~70% at layer 30.
- **A-Anchored (HotpotQA)**: Starts at ~55%, dips to ~25% at layer 15, then stabilizes around ~40–50%.
- **Q-Anchored (NQ)**: Peaks at ~95% at layer 5, drops to ~30% at layer 15, then recovers to ~75% at layer 30.
- **A-Anchored (NQ)**: Starts at ~65%, dips to ~20% at layer 10, then fluctuates between ~30–50%.
#### Right Chart (Mistral-7B-v0.3)
- **Q-Anchored (PopQA)**: Starts at ~70%, dips to ~40% at layer 10, then fluctuates between ~50–70% (peak ~75% at layer 20).
- **A-Anchored (PopQA)**: Starts at ~60%, dips to ~30% at layer 10, then stabilizes around ~40–50%.
- **Q-Anchored (TriviaQA)**: Peaks at ~85% at layer 5, drops to ~35% at layer 15, then recovers to ~70% at layer 30.
- **A-Anchored (TriviaQA)**: Starts at ~50%, dips to ~25% at layer 10, then fluctuates between ~30–50%.
- **Q-Anchored (HotpotQA)**: Peaks at ~80% at layer 10, drops to ~45% at layer 20, then recovers to ~70% at layer 30.
- **A-Anchored (HotpotQA)**: Starts at ~55%, dips to ~25% at layer 15, then stabilizes around ~40–50%.
- **Q-Anchored (NQ)**: Peaks at ~90% at layer 5, drops to ~35% at layer 15, then recovers to ~75% at layer 30.
- **A-Anchored (NQ)**: Starts at ~65%, dips to ~20% at layer 10, then fluctuates between ~30–50%.
---
### Key Observations
1. **Layer-Specific Variability**: Accuracy fluctuates significantly across layers, with sharp drops and recoveries (e.g., TriviaQA Q-Anchored in v0.1 drops 60% from layer 5 to 15).
2. **Anchoring Impact**: Q-Anchored methods generally outperform A-Anchored in most datasets, though performance varies by layer.
3. **Dataset Sensitivity**: NQ (Natural Questions) shows the highest peaks (up to 95%) but also the steepest drops.
4. **Model Version Differences**: v0.3 exhibits slightly more stable trends compared to v0.1, with less extreme dips.
---
### Interpretation
The charts suggest that anchoring methods (Q vs. A) and dataset types (e.g., NQ vs. PopQA) significantly influence model performance. Q-Anchored approaches consistently achieve higher accuracy peaks, but both methods show layer-specific instability. The v0.3 model appears more robust, with reduced volatility in accuracy. The sharp drops (e.g., TriviaQA Q-Anchored in v0.1) may indicate architectural or training-related bottlenecks in specific layers. These patterns highlight the importance of layer-specific optimization for QA tasks.