## Line Chart: Answer Accuracy vs. Layer for Mistral Models
### Overview
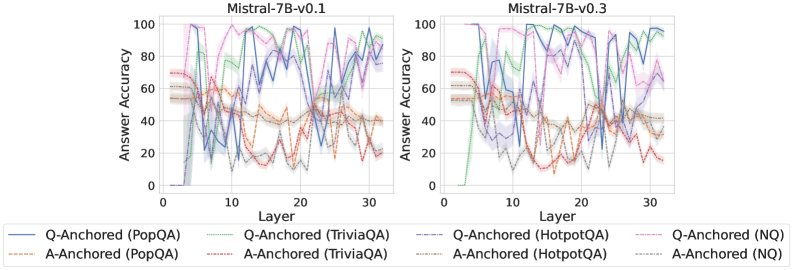
This image presents two line charts, side-by-side, comparing the answer accuracy of the Mistral-7B-v0.1 and Mistral-7B-v0.3 models across different layers. The x-axis represents the layer number (from 0 to 30), and the y-axis represents the answer accuracy (from 0 to 100). Each chart displays multiple lines, each representing a different question-answering dataset and anchoring method.
### Components/Axes
* **X-axis:** Layer (0 to 30, with tick marks at integer values)
* **Y-axis:** Answer Accuracy (0 to 100, with tick marks at integer multiples of 20)
* **Left Chart Title:** Mistral-7B-v0.1
* **Right Chart Title:** Mistral-7B-v0.3
* **Legend (Bottom):**
* Blue Solid Line: Q-Anchored (PopQA)
* Orange Dotted Line: A-Anchored (PopQA)
* Green Solid Line: Q-Anchored (TriviaQA)
* Purple Solid Line: A-Anchored (TriviaQA)
* Brown Dashed Line: Q-Anchored (HotpotQA)
* Teal Solid Line: A-Anchored (HotpotQA)
* Red Dotted Line: Q-Anchored (NQ)
* Yellow Solid Line: A-Anchored (NQ)
### Detailed Analysis or Content Details
**Mistral-7B-v0.1 (Left Chart):**
* **Q-Anchored (PopQA) - Blue Solid Line:** Starts at approximately 5% accuracy at layer 0, rises to a peak of around 95% at layer 6, fluctuates between 60% and 90% for layers 6-20, then gradually increases to approximately 90% at layer 30.
* **A-Anchored (PopQA) - Orange Dotted Line:** Starts at approximately 5% accuracy at layer 0, rises to a peak of around 65% at layer 4, then fluctuates between 30% and 60% for layers 4-30.
* **Q-Anchored (TriviaQA) - Green Solid Line:** Starts at approximately 10% accuracy at layer 0, rises to a peak of around 95% at layer 5, fluctuates between 60% and 90% for layers 5-20, then gradually increases to approximately 95% at layer 30.
* **A-Anchored (TriviaQA) - Purple Solid Line:** Starts at approximately 10% accuracy at layer 0, rises to a peak of around 70% at layer 4, then fluctuates between 30% and 60% for layers 4-30.
* **Q-Anchored (HotpotQA) - Brown Dashed Line:** Starts at approximately 0% accuracy at layer 0, rises to a peak of around 80% at layer 6, fluctuates between 40% and 80% for layers 6-20, then gradually increases to approximately 75% at layer 30.
* **A-Anchored (HotpotQA) - Teal Solid Line:** Starts at approximately 0% accuracy at layer 0, rises to a peak of around 50% at layer 4, then fluctuates between 20% and 50% for layers 4-30.
* **Q-Anchored (NQ) - Red Dotted Line:** Starts at approximately 0% accuracy at layer 0, rises to a peak of around 60% at layer 6, fluctuates between 20% and 60% for layers 6-20, then gradually increases to approximately 50% at layer 30.
* **A-Anchored (NQ) - Yellow Solid Line:** Starts at approximately 0% accuracy at layer 0, rises to a peak of around 40% at layer 4, then fluctuates between 20% and 40% for layers 4-30.
**Mistral-7B-v0.3 (Right Chart):**
* **Q-Anchored (PopQA) - Blue Solid Line:** Starts at approximately 5% accuracy at layer 0, rises to a peak of around 95% at layer 6, fluctuates between 60% and 90% for layers 6-20, then gradually increases to approximately 95% at layer 30.
* **A-Anchored (PopQA) - Orange Dotted Line:** Starts at approximately 5% accuracy at layer 0, rises to a peak of around 65% at layer 4, then fluctuates between 30% and 60% for layers 4-30.
* **Q-Anchored (TriviaQA) - Green Solid Line:** Starts at approximately 10% accuracy at layer 0, rises to a peak of around 95% at layer 5, fluctuates between 60% and 90% for layers 5-20, then gradually increases to approximately 95% at layer 30.
* **A-Anchored (TriviaQA) - Purple Solid Line:** Starts at approximately 10% accuracy at layer 0, rises to a peak of around 70% at layer 4, then fluctuates between 30% and 60% for layers 4-30.
* **Q-Anchored (HotpotQA) - Brown Dashed Line:** Starts at approximately 0% accuracy at layer 0, rises to a peak of around 80% at layer 6, fluctuates between 40% and 80% for layers 6-20, then gradually increases to approximately 75% at layer 30.
* **A-Anchored (HotpotQA) - Teal Solid Line:** Starts at approximately 0% accuracy at layer 0, rises to a peak of around 50% at layer 4, then fluctuates between 20% and 50% for layers 4-30.
* **Q-Anchored (NQ) - Red Dotted Line:** Starts at approximately 0% accuracy at layer 0, rises to a peak of around 60% at layer 6, fluctuates between 20% and 60% for layers 6-20, then gradually increases to approximately 50% at layer 30.
* **A-Anchored (NQ) - Yellow Solid Line:** Starts at approximately 0% accuracy at layer 0, rises to a peak of around 40% at layer 4, then fluctuates between 20% and 40% for layers 4-30.
### Key Observations
* For both models, the Q-Anchored lines generally exhibit higher accuracy than the A-Anchored lines across all datasets.
* The accuracy tends to peak in the early layers (around layers 5-6) and then fluctuates.
* PopQA and TriviaQA datasets show higher accuracy compared to HotpotQA and NQ datasets.
* The two charts (v0.1 and v0.3) are visually very similar, suggesting that the improvement from v0.1 to v0.3 is not dramatically reflected in these accuracy curves.
### Interpretation
The charts demonstrate the performance of the Mistral models on different question-answering tasks as the model depth (layers) increases. The higher accuracy of Q-Anchored methods suggests that anchoring the questions is more effective than anchoring the answers for these tasks. The varying performance across datasets indicates that the models are better at answering questions from some knowledge sources (PopQA, TriviaQA) than others (HotpotQA, NQ). The similarity between the v0.1 and v0.3 charts suggests that the improvements in v0.3 may be more nuanced than a simple increase in overall accuracy, potentially focusing on other aspects of performance like efficiency or robustness. The fluctuating accuracy after the initial peak could indicate that deeper layers introduce complexity or noise that hinders performance on these specific tasks.