## Line Charts: Answer Accuracy by Layer for Mistral-7B Model Versions
### Overview
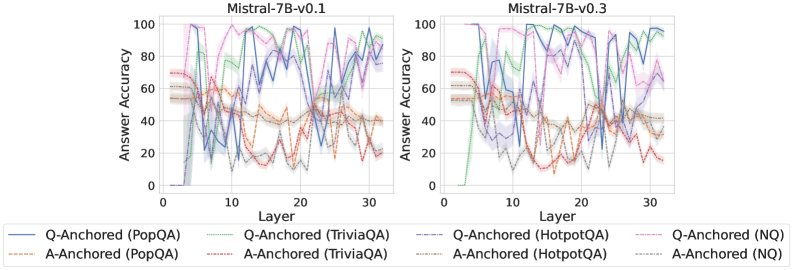
The image displays two side-by-side line charts comparing the "Answer Accuracy" of different question-answering methods across the layers of two versions of the Mistral-7B language model: Mistral-7B-v0.1 (left) and Mistral-7B-v0.3 (right). Each chart plots the performance of eight distinct method-dataset combinations.
### Components/Axes
* **Chart Titles:**
* Left Chart: `Mistral-7B-v0.1`
* Right Chart: `Mistral-7B-v0.3`
* **X-Axis (Both Charts):** Labeled `Layer`. The scale runs from 0 to 30, with major tick marks at 0, 10, 20, and 30.
* **Y-Axis (Both Charts):** Labeled `Answer Accuracy`. The scale runs from 0 to 100, with major tick marks at 0, 20, 40, 60, 80, and 100.
* **Legend (Bottom Center, spanning both charts):** Contains eight entries, differentiating methods by line style and color.
* **Solid Lines (Q-Anchored Methods):**
* Blue: `Q-Anchored (PopQA)`
* Green: `Q-Anchored (TriviaQA)`
* Purple: `Q-Anchored (HotpotQA)`
* Pink: `Q-Anchored (NQ)`
* **Dashed Lines (A-Anchored Methods):**
* Orange: `A-Anchored (PopQA)`
* Red: `A-Anchored (TriviaQA)`
* Brown: `A-Anchored (HotpotQA)`
* Gray: `A-Anchored (NQ)`
### Detailed Analysis
**Mistral-7B-v0.1 (Left Chart):**
* **General Trend:** All lines exhibit high volatility, with sharp peaks and troughs across layers. Performance is highly unstable.
* **Q-Anchored (Solid Lines):** Generally achieve higher peak accuracies (often reaching 80-100) but also experience severe drops (sometimes below 20). The blue (PopQA) and purple (HotpotQA) lines show particularly extreme swings.
* **A-Anchored (Dashed Lines):** Tend to have lower peak accuracies (mostly below 70) and also fluctuate significantly. The orange (PopQA) and red (TriviaQA) lines show a notable dip in accuracy between layers 10-20.
* **Notable Points:** Around layer 5, several Q-Anchored methods (green, purple, pink) spike to near 100% accuracy before dropping sharply. Around layer 25, the blue line (Q-Anchored PopQA) plummets to near 0%.
**Mistral-7B-v0.3 (Right Chart):**
* **General Trend:** Lines appear less volatile than in v0.1, especially for Q-Anchored methods, which show more sustained high performance in the later layers (20-30).
* **Q-Anchored (Solid Lines):** Show a clearer pattern of improvement with depth. The green (TriviaQA) and purple (HotpotQA) lines, in particular, rise to and maintain high accuracy (>80) from layer 20 onward. The blue line (PopQA) still fluctuates but has a higher average.
* **A-Anchored (Dashed Lines):** Continue to show lower and more variable performance compared to their Q-Anchored counterparts. The orange (PopQA) and red (TriviaQA) lines remain in the lower accuracy range (20-50) for most layers.
* **Notable Points:** The green line (Q-Anchored TriviaQA) starts very low (near 0 at layer 0) but climbs steadily to become one of the top performers. The gray line (A-Anchored NQ) shows a distinct peak around layer 15 before declining.
### Key Observations
1. **Method Superiority:** Across both model versions, **Q-Anchored methods (solid lines) consistently outperform their A-Anchored (dashed line) counterparts** on the same dataset. This is the most prominent pattern.
2. **Model Version Improvement:** **Mistral-7B-v0.3 demonstrates more stable and generally higher accuracy** in the later layers (20-30) for Q-Anchored methods compared to v0.1. The chaotic volatility seen in v0.1 is somewhat tamed.
3. **Dataset Sensitivity:** Performance varies significantly by dataset. For example, Q-Anchored on TriviaQA (green) and HotpotQA (purple) shows strong late-layer performance in v0.3, while performance on PopQA (blue) remains more erratic.
4. **Layer Sensitivity:** Accuracy is not monotonic with layer depth. There are specific layers where performance peaks or crashes for various methods, suggesting certain layers are more specialized or sensitive for these tasks.
### Interpretation
This data suggests a fundamental difference in how "Q-Anchored" and "A-Anchored" methods utilize the model's internal representations. The consistent superiority of Q-Anchored methods implies that anchoring the model's processing to the *question* throughout its layers leads to more accurate answers than anchoring to the *answer* candidates.
The comparison between v0.1 and v0.3 indicates that the model update led to **more robust and reliable internal processing for question-answering tasks**, particularly in the deeper layers. The reduced volatility suggests the newer model's representations are more stable and less prone to catastrophic failures at specific layers.
The high layer-to-layer variance, especially in v0.1, is a critical finding. It indicates that a model's QA ability is not a smooth function of depth; instead, specific layers hold disproportionate importance, and performance can be fragile. This has implications for model interpretability and techniques like early exiting or layer-wise probing. The charts serve as a diagnostic tool, revealing that simply averaging performance across layers would mask these crucial dynamics.