# Technical Analysis of WSe2 Visualization Panels (g) and (h)
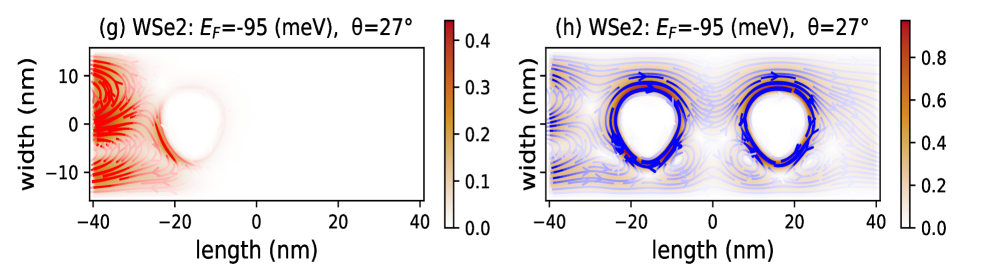
## Panel (g): WSe2 - E_F = -95 meV, θ = 27°
### Axes and Labels
- **X-axis**: `length (nm)` ranging from -40 nm to 40 nm
- **Y-axis**: `width (nm)` ranging from -10 nm to 10 nm
- **Color Scale**:
- **Range**: 0.0 (white) to 0.4 (red)
- **Gradient**: Linear transition from white (low intensity) to red (high intensity)
### Key Features
1. **Localized High-Intensity Region**:
- **Location**: Left side of the plot (length ≈ -20 nm, width ≈ 0 nm)
- **Characteristics**:
- Circular bright red core (peak intensity ≈ 0.4)
- Radiating red streamlines indicating directional flow or field lines
- **Surrounding Area**: Predominantly white (intensity ≈ 0.0), suggesting minimal activity outside the core region.
## Panel (h): WSe2 - E_F = -95 meV, θ = 27°
### Axes and Labels
- **X-axis**: `length (nm)` ranging from -40 nm to 40 nm
- **Y-axis**: `width (nm)` ranging from -10 nm to 10 nm
- **Color Scale**:
- **Range**: 0.0 (white) to 0.8 (red)
- **Gradient**: Linear transition from white (low intensity) to red (high intensity)
### Key Features
1. **Dual High-Intensity Regions**:
- **Location**: Symmetric pairs at (length ≈ ±10 nm, width ≈ 0 nm)
- **Characteristics**:
- Central white cores (intensity ≈ 0.0) surrounded by concentric red/blue rings
- **Outer Ring**: Red (intensity ≈ 0.8) with blue streamlines indicating opposing directional flows
- **Inner Ring**: Blue (intensity ≈ 0.6) with red streamlines, suggesting counter-rotating fields
- **Background**:
- Blue and red streamlines radiating outward from the dual cores
- Gradient intensity transition from white (center) to red/blue (periphery)
### Comparative Observations
- **Color Scale Consistency**:
- Panel (h) uses a broader intensity range (0.0–0.8) compared to panel (g) (0.0–0.4), indicating higher maximum values in (h).
- **Flow Dynamics**:
- Panel (g) shows unidirectional flow emanating from a single core.
- Panel (h) exhibits bidirectional/rotational flow patterns around dual cores, suggesting complex field interactions.
### Legend and Color Bar
- **Panel (g)**:
- Red: 0.4 (maximum intensity)
- White: 0.0 (minimum intensity)
- **Panel (h)**:
- Red: 0.8 (maximum intensity)
- Blue: 0.6 (intermediate intensity)
- White: 0.0 (minimum intensity)
### Technical Context
- **Material**: Tungsten diselenide (WSe₂)
- **Parameters**:
- Fermi energy (`E_F`): -95 meV (electron doping level)
- Polar angle (`θ`): 27° (crystal orientation)
- **Visualization Type**:
- Likely represents charge density, electric field distribution, or similar scalar/vector field data in a 2D material system.