## Line Chart: Reasoning Accuracy vs. Problem Scale
### Overview
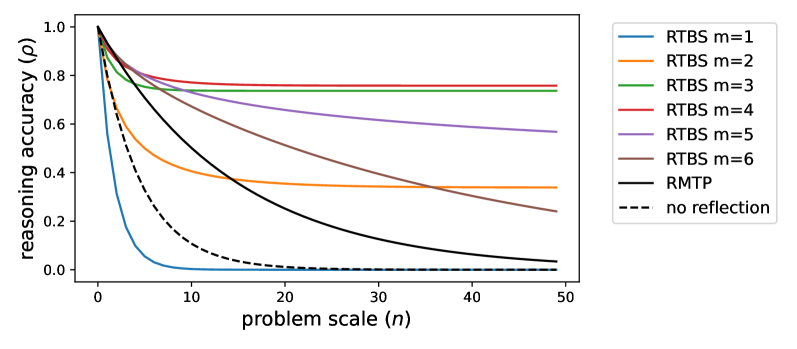
The image is a line chart comparing the reasoning accuracy (ρ) of different algorithms (RTBS with varying 'm' values, RMTP, and 'no reflection') against the problem scale (n). The chart shows how the accuracy of each algorithm changes as the problem scale increases.
### Components/Axes
* **X-axis:** problem scale (n), ranging from 0 to 50 in increments of 10.
* **Y-axis:** reasoning accuracy (ρ), ranging from 0.0 to 1.0 in increments of 0.2.
* **Legend:** Located on the right side of the chart, it identifies each line by algorithm:
* Blue: RTBS m=1
* Orange: RTBS m=2
* Green: RTBS m=3
* Red: RTBS m=4
* Purple: RTBS m=5
* Brown: RTBS m=6
* Black: RMTP
* Dashed Black: no reflection
### Detailed Analysis
* **RTBS m=1 (Blue):** Starts at approximately 0.95 and rapidly decreases to nearly 0 around n=10, remaining close to 0 for the rest of the scale.
* **RTBS m=2 (Orange):** Starts at approximately 0.95 and decreases to around 0.35 by n=50. The rate of decrease slows down as n increases.
* **RTBS m=3 (Green):** Starts at approximately 0.95 and decreases to around 0.73 by n=50. The rate of decrease slows down as n increases.
* **RTBS m=4 (Red):** Starts at approximately 0.95 and remains relatively constant at around 0.75 across the entire problem scale.
* **RTBS m=5 (Purple):** Starts at approximately 0.95 and decreases to around 0.65 by n=50. The rate of decrease slows down as n increases.
* **RTBS m=6 (Brown):** Starts at approximately 0.95 and decreases to around 0.25 by n=50. The rate of decrease slows down as n increases.
* **RMTP (Black):** Starts at 1.0 and decreases to approximately 0.32 by n=50. The rate of decrease slows down as n increases.
* **No reflection (Dashed Black):** Starts at approximately 0.95 and rapidly decreases to nearly 0 around n=20, remaining close to 0 for the rest of the scale.
### Key Observations
* RTBS with m=1 and 'no reflection' show the most significant drop in reasoning accuracy as the problem scale increases.
* RTBS with m=4 maintains the most consistent reasoning accuracy across all problem scales.
* The reasoning accuracy of RMTP decreases more gradually than RTBS with m=1 and 'no reflection'.
* As 'm' increases in RTBS, the reasoning accuracy tends to be higher for larger problem scales.
### Interpretation
The chart illustrates the impact of problem scale on the reasoning accuracy of different algorithms. RTBS with lower 'm' values and 'no reflection' are highly susceptible to decreasing accuracy as the problem scale increases, suggesting they are less robust for larger problems. RMTP and RTBS with higher 'm' values demonstrate better performance and maintain higher accuracy, indicating they are more suitable for handling larger problem scales. The consistent performance of RTBS with m=4 suggests it may be a good choice when a stable reasoning accuracy is desired, regardless of the problem scale. The data suggests that the choice of algorithm and its parameters significantly affects the ability to maintain reasoning accuracy as problem complexity grows.