## Scatter Plot: Gradient Updates vs. Dimension
### Overview
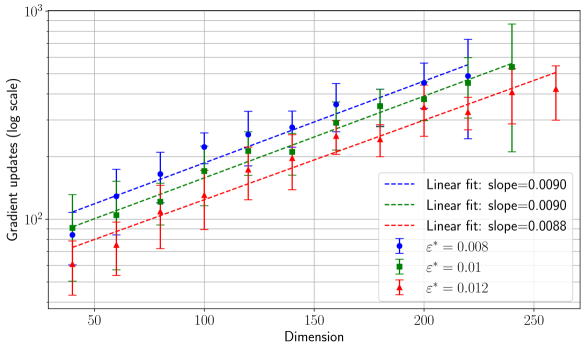
The image is a scatter plot showing the relationship between "Gradient updates (log scale)" and "Dimension" for three different values of epsilon (ε*). The plot includes error bars for each data point and linear fits for each epsilon value. The y-axis uses a logarithmic scale.
### Components/Axes
* **X-axis:** Dimension, ranging from approximately 25 to 275 in increments of 25.
* **Y-axis:** Gradient updates (log scale), ranging from 10^2 (100) to 10^3 (1000). The scale is logarithmic.
* **Legend (Right side of the chart):**
* Blue dashed line: Linear fit: slope=0.0090
* Green dashed line: Linear fit: slope=0.0090
* Red dashed line: Linear fit: slope=0.0088
* Blue circle: ε* = 0.008
* Green square: ε* = 0.01
* Red triangle: ε* = 0.012
### Detailed Analysis
* **ε* = 0.008 (Blue circles):**
* Trend: The number of gradient updates increases as the dimension increases.
* Approximate Data Points:
* Dimension 40: Gradient updates ~90
* Dimension 80: Gradient updates ~150
* Dimension 120: Gradient updates ~200
* Dimension 160: Gradient updates ~250
* Dimension 200: Gradient updates ~300
* Dimension 240: Gradient updates ~400
* Error bars are present at each data point, indicating variability.
* **ε* = 0.01 (Green squares):**
* Trend: The number of gradient updates increases as the dimension increases.
* Approximate Data Points:
* Dimension 40: Gradient updates ~80
* Dimension 80: Gradient updates ~120
* Dimension 120: Gradient updates ~160
* Dimension 160: Gradient updates ~220
* Dimension 200: Gradient updates ~280
* Dimension 240: Gradient updates ~350
* Error bars are present at each data point, indicating variability.
* **ε* = 0.012 (Red triangles):**
* Trend: The number of gradient updates increases as the dimension increases.
* Approximate Data Points:
* Dimension 40: Gradient updates ~50
* Dimension 80: Gradient updates ~100
* Dimension 120: Gradient updates ~140
* Dimension 160: Gradient updates ~180
* Dimension 200: Gradient updates ~230
* Dimension 240: Gradient updates ~300
* Error bars are present at each data point, indicating variability.
* **Linear Fits:**
* The linear fits are represented by dashed lines.
* ε* = 0.008 (Blue): slope = 0.0090
* ε* = 0.01 (Green): slope = 0.0090
* ε* = 0.012 (Red): slope = 0.0088
### Key Observations
* The number of gradient updates generally increases with dimension for all values of ε*.
* The slopes of the linear fits are very similar for ε* = 0.008 and ε* = 0.01, while ε* = 0.012 has a slightly smaller slope.
* The error bars suggest some variability in the number of gradient updates for each dimension and epsilon value.
* For a given dimension, a lower epsilon value (ε*) generally results in a higher number of gradient updates.
### Interpretation
The plot demonstrates that as the dimension increases, the number of gradient updates required also increases, regardless of the epsilon value. The epsilon value (ε*) influences the magnitude of gradient updates, with smaller epsilon values generally leading to a higher number of updates. The similar slopes of the linear fits suggest that the rate of increase in gradient updates with respect to dimension is relatively consistent across different epsilon values. The error bars indicate that there is some inherent variability in the number of gradient updates, which could be due to factors not captured by the dimension or epsilon value alone.