## Chart: Gradient Updates vs. Dimension
### Overview
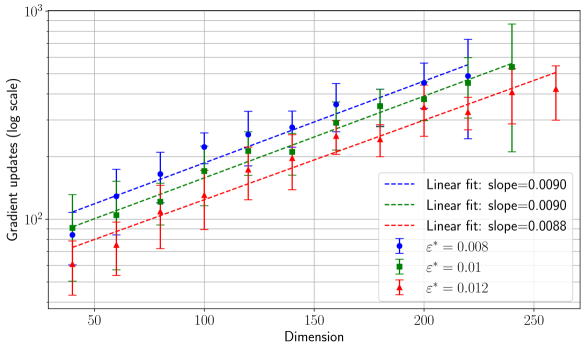
The image presents a chart illustrating the relationship between the number of gradient updates (on a logarithmic scale) and the dimension of a space, for three different values of ε*. The data is presented as scatter plots with error bars, along with linear regression fits for each ε* value.
### Components/Axes
* **X-axis:** Dimension, ranging from approximately 25 to 275.
* **Y-axis:** Gradient updates (log scale), ranging from approximately 10^1 to 10^3.
* **Legend:** Located in the bottom-right corner, containing the following entries:
* ε* = 0.008 (Blue, with circular markers)
* ε* = 0.01 (Green, with square markers)
* ε* = 0.012 (Red, with triangular markers)
* Linear fit: slope=0.0090 (Blue dashed line)
* Linear fit: slope=0.0090 (Green dashed line)
* Linear fit: slope=0.0088 (Red dashed line)
* **Gridlines:** Present to aid in reading values.
### Detailed Analysis
The chart displays three data series, each representing a different ε* value. Each series consists of several data points with associated error bars. Linear regression lines are overlaid on each data series.
**Data Series 1: ε* = 0.008 (Blue)**
* The blue data points show an upward trend, indicating that as the dimension increases, the number of gradient updates also increases.
* Approximate data points (with uncertainty due to visual estimation):
* Dimension = 50, Gradient Updates ≈ 150
* Dimension = 100, Gradient Updates ≈ 250
* Dimension = 150, Gradient Updates ≈ 350
* Dimension = 200, Gradient Updates ≈ 450
* Dimension = 250, Gradient Updates ≈ 550
* The linear fit has a slope of 0.0090.
**Data Series 2: ε* = 0.01 (Green)**
* The green data points also exhibit an upward trend, similar to the blue series.
* Approximate data points:
* Dimension = 50, Gradient Updates ≈ 100
* Dimension = 100, Gradient Updates ≈ 200
* Dimension = 150, Gradient Updates ≈ 300
* Dimension = 200, Gradient Updates ≈ 400
* Dimension = 250, Gradient Updates ≈ 500
* The linear fit has a slope of 0.0090.
**Data Series 3: ε* = 0.012 (Red)**
* The red data points show an upward trend, but appear to have a slightly lower overall value compared to the blue and green series.
* Approximate data points:
* Dimension = 50, Gradient Updates ≈ 75
* Dimension = 100, Gradient Updates ≈ 150
* Dimension = 150, Gradient Updates ≈ 225
* Dimension = 200, Gradient Updates ≈ 300
* Dimension = 250, Gradient Updates ≈ 375
* The linear fit has a slope of 0.0088.
The error bars indicate the variability or uncertainty associated with each data point. The error bars are relatively consistent across the dimension range for each ε* value.
### Key Observations
* All three data series demonstrate a positive correlation between dimension and gradient updates.
* The slope of the linear fit is similar for all three ε* values (around 0.009), suggesting a consistent rate of increase in gradient updates with respect to dimension.
* Higher values of ε* (0.008 and 0.01) generally require more gradient updates than lower values (0.012) for a given dimension.
* The error bars suggest a reasonable degree of confidence in the data, with the variability being relatively small compared to the overall trend.
### Interpretation
The chart suggests that the number of gradient updates required to achieve convergence increases linearly with the dimension of the space. This is a common phenomenon in optimization problems, as higher dimensionality often leads to more complex landscapes and slower convergence rates. The parameter ε* appears to influence the number of gradient updates needed, with smaller values of ε* generally requiring more updates. This could be due to the fact that smaller ε* values lead to smaller step sizes, requiring more iterations to reach the optimal solution. The consistent slopes of the linear fits indicate that the relationship between dimension and gradient updates is relatively stable across different values of ε*. The error bars provide a measure of the uncertainty in the data, which is important for assessing the reliability of the observed trends. The logarithmic scale on the y-axis emphasizes the exponential growth in gradient updates as the dimension increases.