## Scatter Plot with Error Bars and Linear Fits: Gradient Updates vs. Dimension
### Overview
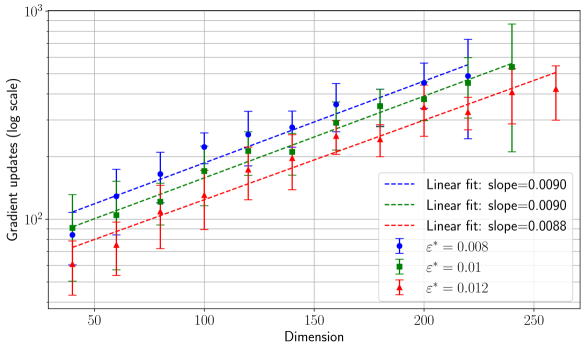
The image is a technical scatter plot with error bars and overlaid linear regression lines. It displays the relationship between "Dimension" (x-axis) and "Gradient updates" on a logarithmic scale (y-axis) for three different experimental conditions, denoted by different values of ε* (epsilon star). The plot includes a legend and grid lines for reference.
### Components/Axes
* **Chart Type:** Scatter plot with error bars and linear fit lines.
* **X-Axis:**
* **Label:** "Dimension"
* **Scale:** Linear scale.
* **Range:** Approximately 40 to 260.
* **Major Ticks:** 50, 100, 150, 200, 250.
* **Y-Axis:**
* **Label:** "Gradient updates (log scale)"
* **Scale:** Logarithmic scale (base 10).
* **Range:** Approximately 50 to 1000.
* **Major Ticks:** 10² (100), 10³ (1000).
* **Legend:** Located in the bottom-right quadrant of the chart area.
* **Blue dashed line:** "Linear fit: slope=0.0090"
* **Green dashed line:** "Linear fit: slope=0.0090"
* **Red dashed line:** "Linear fit: slope=0.0088"
* **Blue circle marker with error bars:** "ε* = 0.008"
* **Green square marker with error bars:** "ε* = 0.01"
* **Red triangle marker with error bars:** "ε* = 0.012"
* **Data Series:** Three distinct series, each represented by a specific color, marker shape, and error bars.
* **Grid:** A light gray grid is present for both major x and y ticks.
### Detailed Analysis
**Trend Verification:** All three data series show a clear, consistent upward trend. As the Dimension increases, the Gradient updates increase. The relationship appears linear on this log-linear plot, indicating an exponential relationship in linear space.
**Data Series & Linear Fits:**
1. **Blue Series (ε* = 0.008):**
* **Marker:** Blue circles.
* **Trend:** The highest of the three series across all dimensions. The data points follow a steady upward slope.
* **Linear Fit:** Blue dashed line with a reported slope of 0.0090.
* **Approximate Data Points (Dimension, Gradient updates):** (40, ~90), (60, ~110), (80, ~130), (100, ~160), (120, ~190), (140, ~220), (160, ~260), (180, ~300), (200, ~350), (220, ~400), (240, ~460).
* **Error Bars:** Present for all points. The vertical span (uncertainty) appears to increase slightly with dimension.
2. **Green Series (ε* = 0.01):**
* **Marker:** Green squares.
* **Trend:** Positioned between the blue and red series. Follows a similar upward slope.
* **Linear Fit:** Green dashed line with a reported slope of 0.0090.
* **Approximate Data Points (Dimension, Gradient updates):** (40, ~80), (60, ~100), (80, ~120), (100, ~140), (120, ~170), (140, ~200), (160, ~230), (180, ~270), (200, ~310), (220, ~360), (240, ~410).
* **Error Bars:** Present for all points. The span is generally smaller than the blue series' error bars at corresponding dimensions.
3. **Red Series (ε* = 0.012):**
* **Marker:** Red triangles.
* **Trend:** The lowest of the three series across all dimensions. Follows a similar upward slope.
* **Linear Fit:** Red dashed line with a reported slope of 0.0088.
* **Approximate Data Points (Dimension, Gradient updates):** (40, ~60), (60, ~75), (80, ~90), (100, ~110), (120, ~130), (140, ~150), (160, ~180), (180, ~210), (200, ~240), (220, ~280), (240, ~320).
* **Error Bars:** Present for all points. The span appears comparable to or slightly larger than the green series' error bars.
### Key Observations
1. **Consistent Ordering:** For any given Dimension, the Gradient updates are consistently highest for ε* = 0.008 (blue), followed by ε* = 0.01 (green), and lowest for ε* = 0.012 (red). This suggests an inverse relationship between the ε* parameter and the magnitude of gradient updates.
2. **Parallel Trends:** The three linear fit lines are nearly parallel, with slopes of 0.0090, 0.0090, and 0.0088. This indicates that the *rate of increase* of gradient updates with respect to dimension is very similar across the three conditions, despite their different absolute levels.
3. **Logarithmic Scale Effect:** The y-axis is logarithmic. The straight-line fits on this plot imply that Gradient updates grow *exponentially* with Dimension in linear space.
4. **Error Bar Pattern:** Error bars are present for all data points, indicating measured variability or confidence intervals. Their size relative to the data values seems fairly consistent across the plot, though absolute span increases with the y-value.
### Interpretation
This chart demonstrates a clear, positive, and approximately exponential relationship between the dimensionality of a problem (or model) and the number of gradient updates required during an optimization process. The key finding is the role of the parameter ε*:
* **What the data suggests:** A smaller ε* value (0.008) leads to a significantly higher number of gradient updates compared to larger ε* values (0.01, 0.012) for the same dimension. This could imply that ε* is a tolerance or step-size related parameter where a smaller value demands more precise (and thus more numerous) updates.
* **How elements relate:** The dimension (x-axis) is the independent variable driving the increase in updates. The ε* parameter acts as a scaling factor, shifting the entire curve up or down without drastically changing its shape (slope). The linear fits quantify this relationship, showing the growth rate is robust across conditions.
* **Notable implications:** The near-identical slopes (0.0090 vs. 0.0088) are striking. They suggest that the fundamental scaling law connecting dimension to optimization cost (in updates) is largely invariant to the ε* parameter within the tested range. The primary effect of ε* is on the constant multiplier, not the scaling exponent. This is valuable for predicting computational cost: if you know the cost for one dimension and one ε*, you can estimate it for another dimension with high confidence, and for another ε* by applying a roughly constant scaling factor. The error bars remind us that these are empirical measurements with inherent variability.