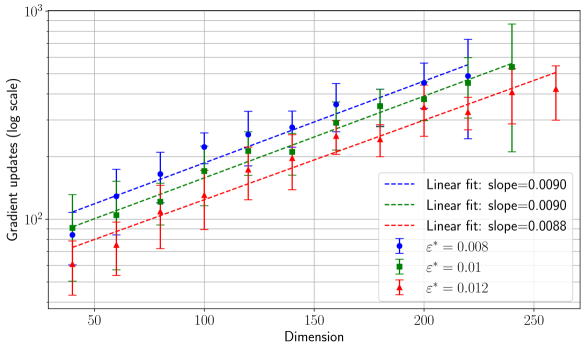
## Line Chart: Gradient Updates vs. Dimension
### Overview
The chart illustrates the relationship between gradient updates (on a logarithmic scale) and dimension size. Three data series are plotted, each with distinct markers and linear fit lines. Error bars indicate variability in the data points.
### Components/Axes
- **X-axis (Dimension)**: Ranges from 50 to 250 in increments of 50.
- **Y-axis (Gradient Updates)**: Logarithmic scale from 10² to 10³.
- **Legend**: Located in the bottom-right corner, associating:
- **Blue dashed line**: Linear fit (slope = 0.0090), ε* = 0.008.
- **Green solid line**: Linear fit (slope = 0.0090), ε* = 0.01.
- **Red dashed line**: Linear fit (slope = 0.0088), ε* = 0.012.
- **Markers**:
- Blue circles (ε* = 0.008).
- Green squares (ε* = 0.01).
- Red triangles (ε* = 0.012).
### Detailed Analysis
1. **Blue Series (ε* = 0.008)**:
- Data points: Blue circles with vertical error bars.
- Linear fit: Slope = 0.0090 (dashed line).
- Trend: Consistent upward trajectory with moderate error margins.
2. **Green Series (ε* = 0.01)**:
- Data points: Green squares with vertical error bars.
- Linear fit: Slope = 0.0090 (solid line).
- Trend: Parallel to the blue series but slightly higher gradient updates at larger dimensions.
3. **Red Series (ε* = 0.012)**:
- Data points: Red triangles with vertical error bars.
- Linear fit: Slope = 0.0088 (dashed line).
- Trend: Slightly flatter than the blue/green series, with larger error margins at higher dimensions.
### Key Observations
- All series exhibit a positive linear relationship between dimension and gradient updates.
- The blue and green series share identical slopes (0.0090), suggesting similar scaling behavior despite different ε* values.
- The red series has a marginally lower slope (0.0088) and higher ε* (0.012), correlating with increased variability in gradient updates.
- Error bars grow larger for all series as dimension increases, particularly noticeable in the red series.
### Interpretation
The data suggests that gradient updates scale linearly with dimension, but the rate of scaling (slope) is influenced by the parameter ε*. Higher ε* values (e.g., 0.012) are associated with reduced slope efficiency and greater variability in updates. The near-identical slopes for ε* = 0.008 and 0.01 imply that small changes in ε* may not significantly alter scaling behavior, while larger ε* values (0.012) introduce notable deviations. The error bars highlight increasing uncertainty in gradient updates at higher dimensions, potentially indicating computational or theoretical limits in the model's stability.