## Dual-Axis Line Chart: Performance Metrics vs. Threshold
### Overview
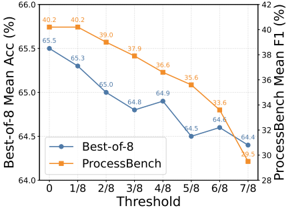
This image is a dual-axis line chart illustrating the performance of two distinct metrics, "Best-of-8" and "ProcessBench," across eight incremental threshold levels ranging from 0 to 7/8. The chart demonstrates how increasing the threshold affects the accuracy (Best-of-8) and the F1 score (ProcessBench).
### Components/Axes
* **X-Axis (Bottom):** Labeled "Threshold". The scale is categorical/ordinal, consisting of 8 steps: 0, 1/8, 2/8, 3/8, 4/8, 5/8, 6/8, 7/8.
* **Left Y-Axis:** Labeled "Best-of-8 Mean Acc (%)". The scale ranges from 64.0 to 66.0.
* **Right Y-Axis:** Labeled "ProcessBench Mean F1 (%)". The scale ranges from 28 to 42.
* **Legend:** Located in the bottom-left quadrant.
* **Blue line with circle markers:** "Best-of-8" (corresponds to the left Y-axis).
* **Orange line with square markers:** "ProcessBench" (corresponds to the right Y-axis).
### Detailed Analysis
#### Trend Verification
* **Best-of-8 (Blue Line):** The trend is generally downward, starting at 65.5% and ending at 64.4%. It exhibits minor fluctuations (slight increases) at the 4/8 and 6/8 thresholds, indicating relative stability despite the increasing threshold.
* **ProcessBench (Orange Line):** The trend is a consistent, steep downward slope. It starts at 40.2% and drops significantly to 29.5%, indicating high sensitivity to the threshold parameter.
#### Data Points
| Threshold | Best-of-8 Mean Acc (%) (Blue) | ProcessBench Mean F1 (%) (Orange) |
| :--- | :--- | :--- |
| 0 | 65.5 | 40.2 |
| 1/8 | 65.3 | 40.2 |
| 2/8 | 65.0 | 39.0 |
| 3/8 | 64.8 | 37.9 |
| 4/8 | 64.9 | 36.6 |
| 5/8 | 64.5 | 35.6 |
| 6/8 | 64.6 | 33.6 |
| 7/8 | 64.4 | 29.5 |
### Key Observations
* **Sensitivity Disparity:** The "ProcessBench" metric is significantly more sensitive to the "Threshold" parameter than "Best-of-8."
* **Magnitude of Change:**
* "Best-of-8" drops by approximately 1.1 percentage points over the entire range (65.5 to 64.4).
* "ProcessBench" drops by approximately 10.7 percentage points over the same range (40.2 to 29.5).
* **Stability:** The "Best-of-8" line shows a "stair-step" pattern with minor recoveries, suggesting it is a more robust metric against the thresholding process.
* **Acceleration:** The decline in "ProcessBench" appears to accelerate between the 6/8 and 7/8 thresholds, where the drop is 4.1 percentage points (33.6 to 29.5), compared to smaller drops in earlier intervals.
### Interpretation
The data suggests that the "Threshold" parameter acts as a restrictive filter on the underlying dataset or model output.
* **Robustness of Best-of-8:** The "Best-of-8" metric maintains high performance even as the threshold increases. This implies that the "Best-of-8" selection strategy is effective at retaining high-quality samples or predictions, even when the pool of available data is restricted by the threshold.
* **Fragility of ProcessBench:** The "ProcessBench" metric is highly dependent on the full distribution of data. As the threshold increases (likely filtering out lower-confidence or lower-scoring items), the F1 score degrades rapidly. This suggests that "ProcessBench" may rely on a broader set of data points to maintain its score, and the thresholding process disproportionately removes the elements that contribute to a high F1 score.
* **Conclusion:** If the goal is to maintain performance while applying a threshold, "Best-of-8" is the superior metric/strategy. "ProcessBench" appears to be a metric that requires a lower threshold to remain valid or useful.