\n
## Line Chart: Best-of-8 Accuracy vs. ProcessBench F1 Score Across Thresholds
### Overview
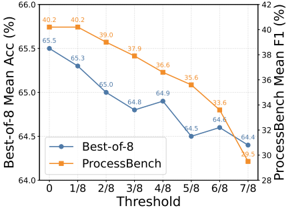
The image is a dual-axis line chart comparing the performance of two metrics, "Best-of-8 Mean Acc (%)" and "ProcessBench Mean F1 (%)", as a function of an increasing "Threshold" parameter. The chart demonstrates a negative correlation between the threshold value and both performance metrics.
### Components/Axes
* **Chart Type:** Dual-axis line chart with markers.
* **X-Axis:**
* **Label:** `Threshold`
* **Scale:** Categorical, with 8 discrete points: `0`, `1/8`, `2/8`, `3/8`, `4/8`, `5/8`, `6/8`, `7/8`.
* **Primary Y-Axis (Left):**
* **Label:** `Best-of-8 Mean Acc (%)`
* **Scale:** Linear, ranging from `64.0` to `66.0`, with major ticks at 0.5 intervals.
* **Secondary Y-Axis (Right):**
* **Label:** `ProcessBench Mean F1 (%)`
* **Scale:** Linear, ranging from `28` to `42`, with major ticks at 2-unit intervals.
* **Legend:**
* **Position:** Bottom center, below the x-axis.
* **Series 1:** `Best-of-8` - Represented by a blue line with circular markers.
* **Series 2:** `ProcessBench` - Represented by an orange line with square markers.
### Detailed Analysis
**Data Series 1: Best-of-8 Mean Acc (%) (Blue Line, Left Axis)**
* **Trend:** The line shows a general downward trend as the threshold increases, with minor fluctuations.
* **Data Points (Threshold, Value):**
* (0, 65.5)
* (1/8, 65.3)
* (2/8, 65.0)
* (3/8, 64.8)
* (4/8, 64.9) *[Slight increase from previous point]*
* (5/8, 64.5)
* (6/8, 64.6) *[Slight increase from previous point]*
* (7/8, 64.4)
**Data Series 2: ProcessBench Mean F1 (%) (Orange Line, Right Axis)**
* **Trend:** The line shows a consistent and more pronounced downward trend compared to the Best-of-8 line. The rate of decrease accelerates after the 3/8 threshold.
* **Data Points (Threshold, Value):**
* (0, 40.7)
* (1/8, 40.7) *[Plateau]*
* (2/8, 39.9)
* (3/8, 37.9)
* (4/8, 36.6)
* (5/8, 35.6)
* (6/8, 32.6)
* (7/8, 30.0)
### Key Observations
1. **Correlated Decline:** Both metrics degrade as the threshold increases, suggesting a trade-off or a common sensitivity to this parameter.
2. **Differential Sensitivity:** The ProcessBench F1 score (orange) is significantly more sensitive to the threshold increase than the Best-of-8 Accuracy (blue). The F1 score drops by approximately 10.7 percentage points (from 40.7% to 30.0%), while the accuracy drops by 1.1 percentage points (from 65.5% to 64.4%).
3. **Non-Linear Drop in F1:** The ProcessBench decline is not linear. It is relatively flat between thresholds 0 and 1/8, then decreases steadily, with the steepest drop occurring between thresholds 5/8 (35.6%) and 6/8 (32.6%).
4. **Minor Fluctuations in Accuracy:** The Best-of-8 accuracy line is not perfectly monotonic, showing small rebounds at thresholds 4/8 and 6/8, though the overall direction is downward.
### Interpretation
The chart likely illustrates the effect of a filtering or confidence threshold on two different evaluation metrics for an AI system (possibly a language model or a reasoning system). "Best-of-8" suggests a sampling-based method where 8 outputs are generated and the best is selected, with accuracy measured against a ground truth. "ProcessBench" appears to be a separate benchmark, possibly evaluating the quality of intermediate reasoning steps (hence "Process") using an F1 score.
The data suggests that **increasing the threshold (which could represent stricter filtering of outputs or steps) harms overall performance, but it disproportionately harms the quality of the process (F1) compared to the final answer accuracy.** This could imply that while stricter filtering might remove some incorrect final answers, it is even more aggressive in removing correct or partially correct reasoning steps, leading to a sharper decline in the process-oriented metric. The plateau in F1 at the lowest thresholds (0 to 1/8) indicates a region where minimal filtering has little effect on process quality. The accelerating decline after 3/8 suggests a critical point beyond which the threshold becomes highly detrimental to the measured process integrity.