## Scatter Plot: Music Genre Distribution in Valid and Test Sets
### Overview
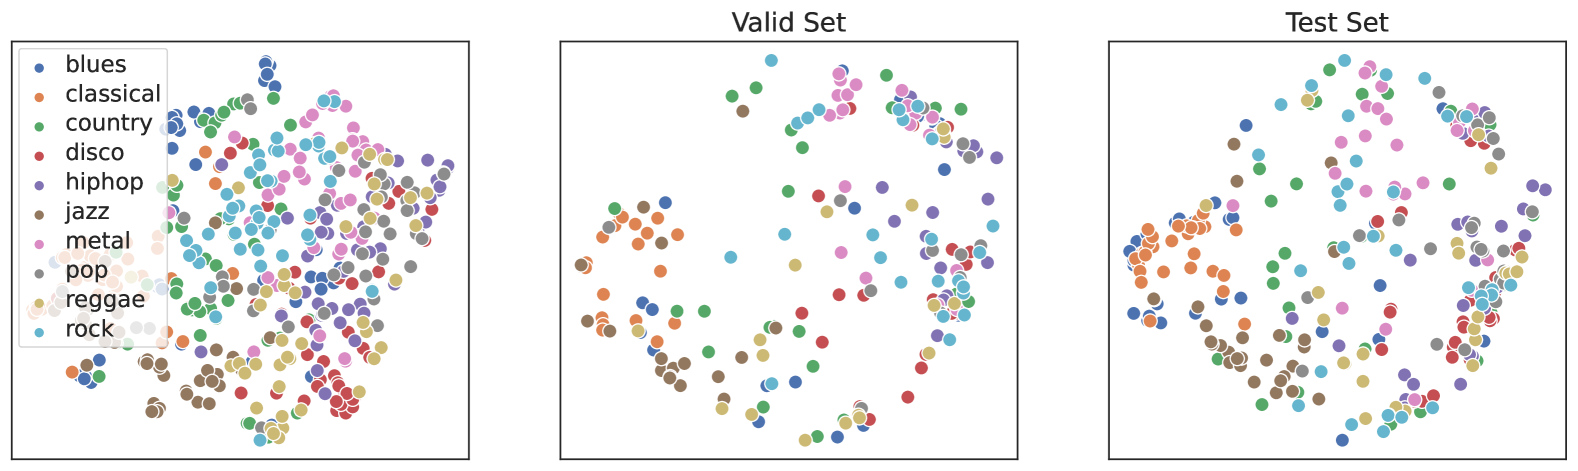
The image displays three panels: a legend on the right and two scatter plots labeled "Valid Set" (left) and "Test Set" (center). Each plot contains colored dots representing 10 music genres (e.g., blues, classical, country, etc.), with positions indicating genre relationships or clustering. The legend maps colors to genres, and no axes or numerical scales are visible.
### Components/Axes
- **Legend**: Located in the top-left corner of the image, listing genres with corresponding colors:
- Blues (blue), Classical (orange), Country (green), Disco (red), Hip-hop (purple), Jazz (brown), Metal (pink), Pop (gray), Reggae (yellow), Rock (cyan).
- **Valid Set (Left Panel)**:
- Title: "Valid Set" (top-center).
- Dots clustered in distinct regions, with some overlap.
- **Test Set (Center Panel)**:
- Title: "Test Set" (top-center).
- Dots more dispersed, with significant overlap between genres.
- **Axes**: No explicit labels or scales; positions inferred spatially.
### Detailed Analysis
1. **Valid Set**:
- **Blues (blue)**: Concentrated in the lower-left quadrant.
- **Classical (orange)**: Clustered in the upper-left quadrant.
- **Country (green)**: Spread across the lower-middle region.
- **Disco (red)**: Tight cluster in the lower-right quadrant.
- **Hip-hop (purple)**: Scattered in the upper-middle region.
- **Jazz (brown)**: Dispersed in the lower-middle to upper-middle.
- **Metal (pink)**: Clustered in the upper-right quadrant.
- **Pop (gray)**: Spread across the central region.
- **Reggae (yellow)**: Concentrated in the lower-right quadrant.
- **Rock (cyan)**: Clustered in the upper-middle region.
2. **Test Set**:
- **Blues (blue)**: Spread across the lower-left to middle regions.
- **Classical (orange)**: Dispersed in the upper-left to middle.
- **Country (green)**: Scattered throughout the lower-middle.
- **Disco (red)**: Overlaps with blues and pop in the lower-middle.
- **Hip-hop (purple)**: Concentrated in the upper-middle to upper-right.
- **Jazz (brown)**: Spread across the lower-middle to upper-middle.
- **Metal (pink)**: Overlaps with rock in the upper-right.
- **Pop (gray)**: Widely dispersed, overlapping with multiple genres.
- **Reggae (yellow)**: Clustered in the lower-right, overlapping with disco.
- **Rock (cyan)**: Spread across the upper-middle to upper-right.
### Key Observations
- **Clustering vs. Dispersion**: The Valid Set shows tighter genre clustering (e.g., blues, classical, disco), while the Test Set exhibits broader dispersion and overlap (e.g., pop, rock, hip-hop).
- **Overlap**: In the Test Set, genres like pop (gray) and rock (cyan) show significant overlap, suggesting potential misclassification.
- **Outliers**: Jazz (brown) and reggae (yellow) appear more dispersed in both sets, possibly indicating ambiguous genre boundaries.
### Interpretation
The Valid Set likely represents training or validation data where genres are well-separated, indicating effective model performance on known patterns. The Test Set’s dispersion suggests the model struggles with generalization, as genres like pop and rock overlap, potentially due to shared characteristics or insufficient training data. Jazz and reggae’s ambiguity in both sets may reflect inherent genre fluidity or data quality issues. The lack of axes implies the plot visualizes latent space embeddings, where spatial proximity reflects similarity in learned features.