## Bar Chart: Success Rate by Factor
### Overview
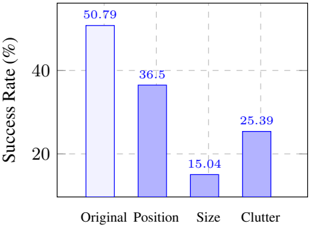
The image displays a bar chart comparing success rates across three factors: "Original Position," "Size," and "Clutter." The y-axis represents success rate as a percentage (0–60%), while the x-axis categorizes the factors. Three bars are present, with values explicitly labeled on top of each bar.
### Components/Axes
- **Y-Axis**: Labeled "Success Rate (%)" with increments of 20% (0, 20, 40, 60).
- **X-Axis**: Categorized into "Original Position," "Size," and "Clutter."
- **Legend**: Located at the top-right, associating:
- Light blue with "Original Position."
- Dark blue with "Size" and "Clutter."
### Detailed Analysis
- **Original Position**:
- Value: **50.79%** (light blue bar).
- Position: Leftmost bar, tallest in the chart.
- **Size**:
- Value: **36.5%** (dark blue bar).
- Position: Middle bar, shorter than "Original Position."
- **Clutter**:
- Value: **25.39%** (dark blue bar).
- Position: Rightmost bar, shortest in the chart.
### Key Observations
1. **Trend Verification**:
- The bars decrease in height from left to right, confirming a descending trend in success rate: **50.79% → 36.5% → 25.39%**.
- The legend colors align with the bars: light blue for "Original Position" and dark blue for the other two categories.
2. **Outliers/Anomalies**:
- No outliers; all values follow a consistent downward trend.
- "Clutter" has the lowest success rate, while "Original Position" dominates.
### Interpretation
The data suggests that **Original Position** is the most critical factor for success, outperforming "Size" and "Clutter" by significant margins. The descending trend implies that factors related to positioning have a stronger impact than those tied to size or clutter. This could reflect a scenario where spatial arrangement (e.g., in user interface design, logistics, or cognitive tasks) is prioritized over other variables. The consistent color coding in the legend reinforces clarity, ensuring no misinterpretation of categories.