# Technical Data Extraction: Success Rate Comparison Chart
## 1. Image Classification and Overview
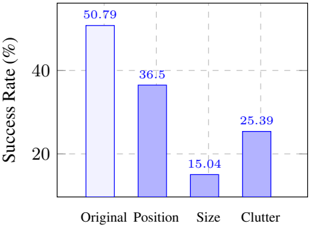
This image is a **vertical bar chart** (column chart) illustrating the "Success Rate (%)" across four distinct experimental conditions or categories. The chart uses a blue color scheme with varying shades and includes precise numerical data labels above each bar.
## 2. Component Isolation
### A. Header/Title
* **Status:** No explicit title is present within the image frame.
### B. Y-Axis (Vertical)
* **Label:** Success Rate (%)
* **Orientation:** Rotated 90 degrees counter-clockwise.
* **Scale Markers:** 20, 40.
* **Gridlines:** Horizontal dashed lines are present at the 20 and 40 marks, as well as at the top boundary (implied 60).
### C. X-Axis (Horizontal)
* **Categories:** Four discrete labels.
1. Original
2. Position
3. Size
4. Clutter
* **Gridlines:** Vertical dashed lines separate the categories.
### D. Main Data Region (Bars)
* **Visual Style:** Blue-bordered bars with light blue/lavender fills.
* **Data Labels:** Numerical values are printed in blue text directly above each bar.
---
## 3. Data Table Reconstruction
| Category | Success Rate (%) | Visual Trend Description |
| :--- | :--- | :--- |
| **Original** | 50.79 | Highest value; bar extends well above the 40% gridline. |
| **Position** | 36.5 | Second highest; bar sits just below the 40% gridline. |
| **Size** | 15.04 | Lowest value; bar sits below the 20% gridline. |
| **Clutter** | 25.39 | Third highest; bar sits slightly above the 20% gridline. |
---
## 4. Trend Analysis and Key Findings
* **Baseline Performance:** The "Original" category represents the peak performance at **50.79%**.
* **Impact of Variables:** All modifications (Position, Size, Clutter) result in a decrease in the Success Rate compared to the "Original" baseline.
* **Most Significant Inhibitor:** The "Size" variable has the most detrimental effect on the success rate, causing it to drop to its minimum of **15.04%**.
* **Relative Impact:**
* Changing **Position** reduces success by approximately 14.29 percentage points.
* Adding **Clutter** reduces success by approximately 25.4 percentage points.
* Changing **Size** reduces success by approximately 35.75 percentage points.
## 5. Spatial Grounding and Visual Properties
* **Legend:** No legend is present; the categories are labeled directly on the X-axis.
* **Color Consistency:** All bars utilize a blue outline. The "Original" bar has a noticeably lighter fill (near-white/very light lavender) compared to the other three bars, which share a consistent medium-light blue fill. This visual distinction likely highlights "Original" as the control group.
* **Grid:** The chart uses a 3x3 dashed grid structure within the plot area to assist in visual alignment.