## Box Plot Chart: Performance Comparison of Music Models Across Datasets
### Overview
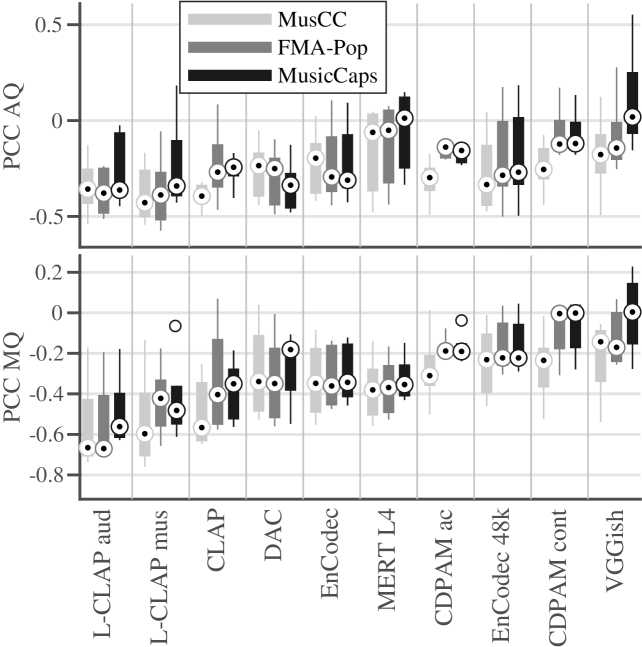
The image displays two vertically stacked box plots comparing the performance of three music models (MusCC, FMA-Pop, MusicCaps) across 12 datasets. The top subplot measures "PCC AQ" (Pearson Correlation Coefficient - Audio Quality), while the bottom subplot measures "PCC MQ" (Pearson Correlation Coefficient - Music Quality). Each box plot shows the distribution of scores for each model-dataset pair, with medians, quartiles, and outliers marked.
---
### Components/Axes
- **X-axis**: Dataset names (e.g., "L-CLAP aud", "mus", "CLAP", "DAC", "EnCodec", "MERT L4", "CDPAM ac", "EnCodec 48k", "CDPAM cont", "VGGish").
- **Y-axis (Top Subplot)**: "PCC AQ" (range: -0.8 to 0.5).
- **Y-axis (Bottom Subplot)**: "PCC MQ" (range: -0.8 to 0.2).
- **Legend**: Located in the top-left corner, with three color-coded models:
- **MusCC**: Light gray (■)
- **FMA-Pop**: Dark gray (■)
- **MusicCaps**: Black (■)
---
### Detailed Analysis
#### Top Subplot (PCC AQ)
- **Median Values**:
- **MusicCaps** consistently shows the highest medians (e.g., ~0.3 in "MERT L4", ~0.2 in "CDPAM ac").
- **FMA-Pop** has the lowest medians (e.g., ~-0.2 in "MERT L4", ~-0.1 in "CDPAM ac").
- **MusCC** falls between the two, with medians ranging from ~-0.1 to ~0.1.
- **Outliers**:
- **MusicCaps** has outliers in "EnCodec" (~0.4) and "CDPAM 48k" (~0.3).
- **FMA-Pop** has outliers in "EnCodec" (~-0.3) and "CDPAM 48k" (~-0.2).
- **Trends**:
- MusicCaps generally outperforms other models, with a slight upward trend in median values across datasets.
- FMA-Pop shows the most variability, with some datasets (e.g., "EnCodec") having lower medians.
#### Bottom Subplot (PCC MQ)
- **Median Values**:
- **MusicCaps** again leads, with medians around ~-0.1 to ~0.1.
- **FMA-Pop** has the lowest medians (e.g., ~-0.3 in "MERT L4", ~-0.2 in "CDPAM ac").
- **MusCC** shows moderate performance, with medians between ~-0.2 and ~0.0.
- **Outliers**:
- **MusicCaps** has outliers in "EnCodec" (~-0.4) and "CDPAM 48k" (~-0.3).
- **FMA-Pop** has outliers in "EnCodec" (~-0.5) and "CDPAM 48k" (~-0.4).
- **Trends**:
- MusicCaps maintains higher performance than FMA-Pop, but both models show negative medians in some datasets.
---
### Key Observations
1. **Model Performance**:
- **MusicCaps** consistently outperforms **FMA-Pop** and **MusCC** in both PCC AQ and PCC MQ across most datasets.
- **FMA-Pop** exhibits the most variability, with lower medians and more outliers in certain datasets (e.g., "EnCodec", "CDPAM 48k").
2. **Dataset Variability**:
- **EnCodec** and **CDPAM 48k** show the most significant deviations, with outliers in both subplots.
- **MERT L4** and **CDPAM ac** demonstrate the highest performance for MusicCaps in PCC AQ.
3. **Negative Values**:
- Both subplots include negative values, indicating some datasets where models underperformed relative to the baseline.
---
### Interpretation
The data suggests that **MusicCaps** is the most effective model for audio and music quality metrics across the tested datasets, with **FMA-Pop** showing the weakest performance. The presence of outliers in specific datasets (e.g., "EnCodec", "CDPAM 48k") highlights potential inconsistencies in model behavior under certain conditions. The negative values in some datasets may indicate limitations in model generalizability or dataset-specific challenges. This comparison underscores the importance of model selection based on dataset characteristics and evaluation criteria.