## Chart Type: Line Graphs Comparing Model Performance
### Overview
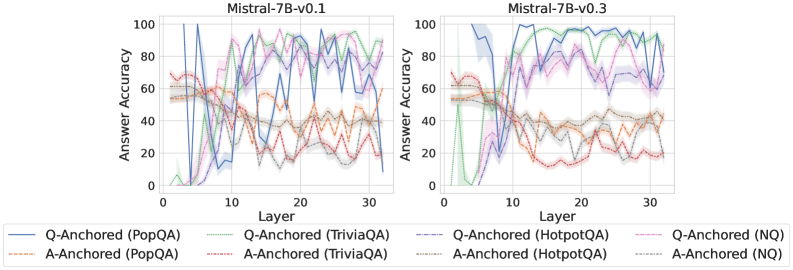
The image contains two line graphs comparing the performance of two versions of the Mistral-7B model (v0.1 and v0.3) on various question-answering tasks. The graphs plot "Answer Accuracy" against "Layer" for different question-answering datasets, distinguishing between question-anchored (Q-Anchored) and answer-anchored (A-Anchored) approaches.
### Components/Axes
* **Titles:**
* Left Graph: "Mistral-7B-v0.1"
* Right Graph: "Mistral-7B-v0.3"
* **Y-axis (Answer Accuracy):**
* Label: "Answer Accuracy"
* Scale: 0 to 100, with tick marks at 0, 20, 40, 60, 80, and 100.
* **X-axis (Layer):**
* Label: "Layer"
* Scale: 0 to 30, with tick marks at intervals of 10.
* **Legend (bottom of the image):**
* Q-Anchored (PopQA): Solid Blue Line
* A-Anchored (PopQA): Dashed Brown Line
* Q-Anchored (TriviaQA): Dotted Green Line
* A-Anchored (TriviaQA): Dash-Dot Orange Line
* Q-Anchored (HotpotQA): Dash-Dot-Dot Red Line
* A-Anchored (HotpotQA): Dotted-Dashed-Dashed Brown Line
* Q-Anchored (NQ): Dashed Purple Line
* A-Anchored (NQ): Dotted Gray Line
### Detailed Analysis
**Left Graph (Mistral-7B-v0.1):**
* **Q-Anchored (PopQA) - Solid Blue Line:** Starts near 0% accuracy, rapidly increases to approximately 80% by layer 10, and then fluctuates between 70% and 100% for the remaining layers.
* **A-Anchored (PopQA) - Dashed Brown Line:** Starts around 60% accuracy, decreases to approximately 30% by layer 10, and then fluctuates between 30% and 40% for the remaining layers.
* **Q-Anchored (TriviaQA) - Dotted Green Line:** Starts near 60% accuracy, decreases to approximately 40% by layer 10, and then fluctuates between 70% and 90% for the remaining layers.
* **A-Anchored (TriviaQA) - Dash-Dot Orange Line:** Starts around 60% accuracy, decreases to approximately 30% by layer 10, and then fluctuates between 30% and 40% for the remaining layers.
* **Q-Anchored (HotpotQA) - Dash-Dot-Dot Red Line:** Starts around 70% accuracy, decreases to approximately 20% by layer 10, and then fluctuates between 20% and 40% for the remaining layers.
* **A-Anchored (HotpotQA) - Dotted-Dashed-Dashed Brown Line:** Starts around 60% accuracy, decreases to approximately 40% by layer 10, and then fluctuates between 40% and 50% for the remaining layers.
* **Q-Anchored (NQ) - Dashed Purple Line:** Starts near 60% accuracy, increases to approximately 80% by layer 10, and then fluctuates between 70% and 100% for the remaining layers.
* **A-Anchored (NQ) - Dotted Gray Line:** Starts around 60% accuracy, decreases to approximately 40% by layer 10, and then fluctuates between 40% and 50% for the remaining layers.
**Right Graph (Mistral-7B-v0.3):**
* **Q-Anchored (PopQA) - Solid Blue Line:** Starts near 0% accuracy, rapidly increases to approximately 80% by layer 10, and then fluctuates between 80% and 100% for the remaining layers.
* **A-Anchored (PopQA) - Dashed Brown Line:** Starts around 60% accuracy, decreases to approximately 30% by layer 10, and then fluctuates between 30% and 40% for the remaining layers.
* **Q-Anchored (TriviaQA) - Dotted Green Line:** Starts near 0% accuracy, increases to approximately 80% by layer 10, and then fluctuates between 80% and 100% for the remaining layers.
* **A-Anchored (TriviaQA) - Dash-Dot Orange Line:** Starts around 60% accuracy, decreases to approximately 20% by layer 10, and then fluctuates between 20% and 40% for the remaining layers.
* **Q-Anchored (HotpotQA) - Dash-Dot-Dot Red Line:** Starts around 60% accuracy, decreases to approximately 10% by layer 10, and then fluctuates between 10% and 30% for the remaining layers.
* **A-Anchored (HotpotQA) - Dotted-Dashed-Dashed Brown Line:** Starts around 60% accuracy, decreases to approximately 30% by layer 10, and then fluctuates between 30% and 40% for the remaining layers.
* **Q-Anchored (NQ) - Dashed Purple Line:** Starts near 60% accuracy, increases to approximately 80% by layer 10, and then fluctuates between 70% and 90% for the remaining layers.
* **A-Anchored (NQ) - Dotted Gray Line:** Starts around 60% accuracy, decreases to approximately 40% by layer 10, and then fluctuates between 40% and 50% for the remaining layers.
### Key Observations
* For both model versions, Q-Anchored approaches generally achieve higher accuracy than A-Anchored approaches after layer 10.
* The accuracy of A-Anchored approaches tends to decrease in the initial layers before stabilizing.
* The Q-Anchored (PopQA) and Q-Anchored (TriviaQA) datasets show a significant increase in accuracy after layer 5 for Mistral-7B-v0.3.
* The performance on HotpotQA is generally lower compared to other datasets for both Q-Anchored and A-Anchored approaches.
* The shaded regions around each line indicate the uncertainty or variance in the accuracy measurements.
### Interpretation
The graphs suggest that the Mistral-7B models learn to answer questions more effectively as they process information through deeper layers. The difference in performance between Q-Anchored and A-Anchored approaches indicates that the way the question and answer are presented to the model significantly impacts its ability to provide accurate answers. The lower performance on HotpotQA suggests that this dataset, which requires more complex reasoning, is more challenging for the models. The improvement in Q-Anchored (PopQA) and Q-Anchored (TriviaQA) from v0.1 to v0.3 indicates that the newer version of the model has improved its ability to handle these specific question-answering tasks. The uncertainty regions highlight the variability in the model's performance, which could be due to factors such as the specific questions being asked or the training data used.