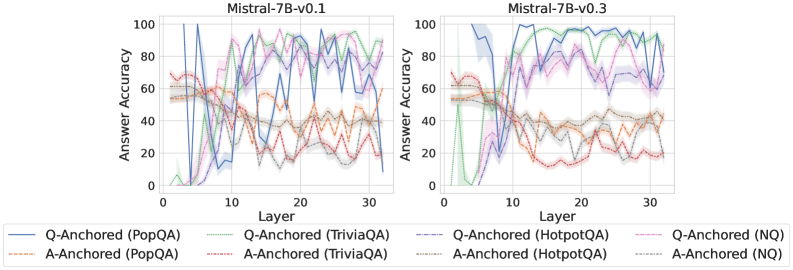
## Line Charts: Mistral-7B Model Layer-wise Answer Accuracy
### Overview
The image displays two side-by-side line charts comparing the layer-wise answer accuracy of two versions of the Mistral-7B language model (v0.1 and v0.3) across four different question-answering datasets. Each chart plots "Answer Accuracy" (y-axis) against the model's internal "Layer" number (x-axis) for two anchoring methods: "Q-Anchored" (question-anchored) and "A-Anchored" (answer-anchored).
### Components/Axes
* **Chart Titles:** "Mistral-7B-v0.1" (left chart), "Mistral-7B-v0.3" (right chart).
* **X-Axis:** Labeled "Layer". Scale runs from 0 to approximately 32, with major tick marks at 0, 10, 20, and 30.
* **Y-Axis:** Labeled "Answer Accuracy". Scale runs from 0 to 100, with major tick marks at 0, 20, 40, 60, 80, and 100.
* **Legend:** Positioned below both charts. It defines eight data series using a combination of color and line style:
* **Q-Anchored Series (Solid Lines):**
* Blue solid line: `Q-Anchored (PopQA)`
* Green solid line: `Q-Anchored (TriviaQA)`
* Purple solid line: `Q-Anchored (HotpotQA)`
* Pink solid line: `Q-Anchored (NQ)`
* **A-Anchored Series (Dashed/Dotted Lines):**
* Orange dashed line: `A-Anchored (PopQA)`
* Red dashed line: `A-Anchored (TriviaQA)`
* Brown dashed line: `A-Anchored (HotpotQA)`
* Gray dashed line: `A-Anchored (NQ)`
### Detailed Analysis
**Chart 1: Mistral-7B-v0.1**
* **Trend Verification:** The Q-Anchored (solid) lines generally show an initial rise, peak in the middle layers (approx. layers 8-20), and then exhibit high variance or decline in later layers. The A-Anchored (dashed) lines tend to start higher in early layers but show a more consistent downward trend as layer depth increases.
* **Data Points (Approximate):**
* **Q-Anchored (PopQA - Blue Solid):** Starts near 0% at layer 0, spikes to ~100% around layer 8, then fluctuates wildly between ~40% and ~100% for the remaining layers.
* **Q-Anchored (TriviaQA - Green Solid):** Starts near 0%, rises to ~80% by layer 10, peaks near ~95% around layer 25, and ends near ~80% at layer 32.
* **A-Anchored (PopQA - Orange Dashed):** Starts around ~60% at layer 0, gradually declines with fluctuations, ending near ~40% at layer 32.
* **A-Anchored (TriviaQA - Red Dashed):** Starts around ~70%, declines steadily to ~20% by layer 20, and remains low.
**Chart 2: Mistral-7B-v0.3**
* **Trend Verification:** A significant shift is visible. The Q-Anchored (solid) lines rise sharply and reach high accuracy (>80%) by layer 10, maintaining high performance with less variance through the later layers. The A-Anchored (dashed) lines still show a declining trend but start from a lower initial point compared to v0.1.
* **Data Points (Approximate):**
* **Q-Anchored (PopQA - Blue Solid):** Rises steeply from ~0% to ~100% by layer 8, and remains consistently near or at 100% through layer 32.
* **Q-Anchored (TriviaQA - Green Solid):** Follows a similar steep rise to ~90% by layer 10 and stays between ~85%-95% thereafter.
* **A-Anchored (PopQA - Orange Dashed):** Starts around ~55%, declines to ~40% by layer 15, and fluctuates around 30-40% for later layers.
* **A-Anchored (TriviaQA - Red Dashed):** Starts around ~65%, drops sharply to ~20% by layer 12, and remains very low (~10-20%).
### Key Observations
1. **Version Comparison:** Mistral-7B-v0.3 shows a dramatic improvement in the performance of Q-Anchored methods. They achieve high accuracy much earlier (by layer ~8-10) and sustain it, whereas in v0.1, performance was more volatile and peaked later.
2. **Anchoring Method Divergence:** Across both model versions, Q-Anchored methods consistently outperform A-Anchored methods in the middle and later layers. The gap between the two methods widens significantly in v0.3.
3. **Dataset Variability:** Performance varies by dataset. For example, in v0.3, `Q-Anchored (PopQA)` reaches a perfect 100% and stays there, while `Q-Anchored (HotpotQA)` (purple solid) shows more fluctuation between 60-90% in the later layers.
4. **Early Layer Behavior:** In both models, accuracy for most series is low in the very first layers (0-5), indicating the initial layers are not specialized for this task.
### Interpretation
The data suggests a fundamental difference in how information is processed across the layers of the two model versions. The "Q-Anchored" approach, which likely measures the model's internal representation of the question, becomes a strong predictor of final answer accuracy early in the network of v0.3. This implies that v0.3 has developed more robust and task-relevant representations in its early-to-mid layers.
Conversely, the declining trend of "A-Anchored" accuracy suggests that the direct representation of the answer becomes less determinative or is transformed as information flows through the network. The stark improvement from v0.1 to v0.3 indicates that the model update significantly enhanced the model's ability to encode and preserve question-relevant information through its processing depth, leading to more reliable performance. The persistent variability in datasets like HotpotQA (which involves multi-hop reasoning) highlights that complex reasoning remains a greater challenge even in the improved model.