## Line Graphs: Answer Accuracy Across Layers for Mistral-7B Models (v0.1 and v0.3)
### Overview
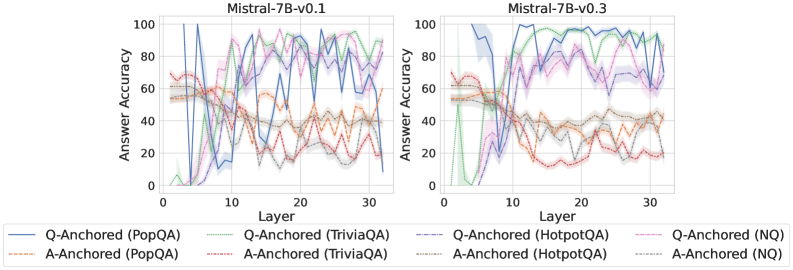
The image contains two side-by-side line graphs comparing answer accuracy across transformer model layers (0–30) for two versions of the Mistral-7B model (v0.1 and v0.3). Each graph includes six data series representing different anchoring methods (Q-Anchored and A-Anchored) and datasets (PopQA, TriviaQA, HotpotQA, NQ). The graphs use color-coded lines with shaded confidence intervals.
---
### Components/Axes
- **Y-Axis**: Answer Accuracy (%)
- Range: 0–100%
- Label: "Answer Accuracy"
- **X-Axis**: Layer
- Range: 0–30
- Label: "Layer"
- **Legends**:
- **Left Graph (v0.1)**:
- Q-Anchored (PopQA): Solid blue
- A-Anchored (PopQA): Dashed orange
- Q-Anchored (TriviaQA): Solid green
- A-Anchored (TriviaQA): Dashed brown
- **Right Graph (v0.3)**:
- Q-Anchored (HotpotQA): Solid purple
- A-Anchored (HotpotQA): Dashed gray
- Q-Anchored (NQ): Solid pink
- A-Anchored (NQ): Dashed red
---
### Detailed Analysis
#### Left Graph (Mistral-7B-v0.1)
1. **Q-Anchored (PopQA)** (Solid Blue):
- Starts at ~80% accuracy at layer 0, drops sharply to ~20% by layer 5, then fluctuates between 30–70% with peaks at layers 10, 15, and 25.
2. **A-Anchored (PopQA)** (Dashed Orange):
- Starts at ~60%, dips to ~40% by layer 10, then stabilizes between 40–60% with minor oscillations.
3. **Q-Anchored (TriviaQA)** (Solid Green):
- Begins at ~70%, plunges to ~10% by layer 5, then oscillates between 20–60% with a peak at layer 20.
4. **A-Anchored (TriviaQA)** (Dashed Brown):
- Starts at ~50%, drops to ~30% by layer 10, then fluctuates between 30–50% with a peak at layer 25.
#### Right Graph (Mistral-7B-v0.3)
1. **Q-Anchored (HotpotQA)** (Solid Purple):
- Starts at ~70%, peaks at ~90% by layer 10, then declines to ~60% by layer 30 with minor fluctuations.
2. **A-Anchored (HotpotQA)** (Dashed Gray):
- Starts at ~50%, rises to ~70% by layer 15, then stabilizes between 60–70% with slight dips.
3. **Q-Anchored (NQ)** (Solid Pink):
- Begins at ~60%, drops to ~40% by layer 10, then fluctuates between 30–60% with a peak at layer 25.
4. **A-Anchored (NQ)** (Dashed Red):
- Starts at ~40%, rises to ~60% by layer 20, then declines to ~40% by layer 30 with oscillations.
---
### Key Observations
1. **Model Version Differences**:
- v0.3 shows smoother trends and higher overall accuracy compared to v0.1, which exhibits sharper fluctuations.
2. **Dataset-Specific Performance**:
- **HotpotQA** (v0.3) achieves the highest peak accuracy (~90%) among all datasets.
- **NQ** (v0.3) shows the most erratic behavior, with a sharp drop at layer 10.
3. **Anchoring Method Trends**:
- Q-Anchored methods generally outperform A-Anchored in v0.3 but underperform in v0.1 for PopQA and TriviaQA.
- A-Anchored methods in v0.1 (e.g., PopQA) exhibit more stability but lower peaks.
---
### Interpretation
The data suggests that model version v0.3 improves stability and accuracy across layers compared to v0.1. Q-Anchored methods perform better for HotpotQA and NQ in v0.3, while A-Anchored methods show resilience in v0.1 for PopQA and TriviaQA. The sharp dips in v0.1 (e.g., Q-Anchored TriviaQA at layer 5) may indicate architectural instability in early layers, whereas v0.3’s smoother curves suggest refined training or architecture. The dataset-specific performance highlights the importance of anchoring strategies tailored to question types (e.g., HotpotQA’s reliance on Q-Anchored methods).