## Chart: Llama-3.1-8B Proportion of Flips
### Overview
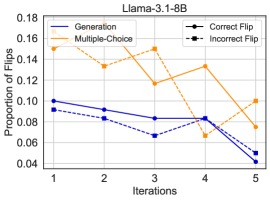
The image is a line chart comparing the proportion of flips across iterations for two methods: Generation and Multiple-Choice. It also distinguishes between Correct and Incorrect Flips. The x-axis represents iterations (1 to 5), and the y-axis represents the proportion of flips (0.04 to 0.18).
### Components/Axes
* **Title:** Llama-3.1-8B
* **X-axis:** Iterations (labeled 1, 2, 3, 4, 5)
* **Y-axis:** Proportion of Flips (labeled 0.04, 0.06, 0.08, 0.10, 0.12, 0.14, 0.16, 0.18)
* **Legend:** Located at the top-right of the chart.
* **Generation:** Solid blue line
* **Multiple-Choice:** Solid orange line
* **Correct Flip:** Solid black line with circle markers
* **Incorrect Flip:** Dashed black line with square markers
### Detailed Analysis
* **Generation:**
* Trend: Generally decreasing.
* Iteration 1: ~0.092
* Iteration 2: ~0.092
* Iteration 3: ~0.083
* Iteration 4: ~0.083
* Iteration 5: ~0.042
* **Multiple-Choice:**
* Trend: Fluctuating, with an overall decrease.
* Iteration 1: ~0.152
* Iteration 2: ~0.133
* Iteration 3: ~0.152
* Iteration 4: ~0.133
* Iteration 5: ~0.078
* **Correct Flip:**
* Trend: Decreasing.
* Iteration 1: ~0.10
* Iteration 2: ~0.083
* Iteration 3: ~0.067
* Iteration 4: ~0.075
* Iteration 5: ~0.05
* **Incorrect Flip:**
* Trend: Decreasing.
* Iteration 1: ~0.092
* Iteration 2: ~0.083
* Iteration 3: ~0.067
* Iteration 4: ~0.075
* Iteration 5: ~0.042
### Key Observations
* The proportion of flips for both Generation and Multiple-Choice methods decreases over iterations.
* The Multiple-Choice method starts with a higher proportion of flips but ends up lower than the Generation method by the 5th iteration.
* The "Correct Flip" and "Incorrect Flip" lines are very close to each other, and both show a decreasing trend.
### Interpretation
The chart suggests that as the Llama-3.1-8B model iterates, the proportion of flips decreases for both Generation and Multiple-Choice methods, indicating improved stability or convergence. The Multiple-Choice method initially has a higher proportion of flips, possibly due to the nature of selecting from multiple options, but it decreases more significantly than the Generation method. The close proximity of the "Correct Flip" and "Incorrect Flip" lines suggests that the model's ability to correct or incorrectly flip its decisions is relatively consistent across iterations. The overall decreasing trend indicates that the model becomes more consistent in its decisions as it iterates.