\n
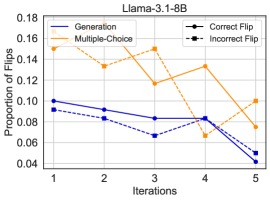
## Line Chart: Llama-3.1-8B Performance Over Iterations
### Overview
This line chart depicts the proportion of flips for different methods (Generation, Multiple-Choice, Correct Flip, Incorrect Flip) across five iterations. The chart aims to illustrate how these methods perform in terms of flipping outcomes as the number of iterations increases. The title "Llama-3.1-8B" suggests this data relates to a model with that specific configuration.
### Components/Axes
* **X-axis:** Iterations (labeled 1 to 5).
* **Y-axis:** Proportion of Flips (scale from 0.04 to 0.18).
* **Legend:** Located in the top-right corner, defining the lines:
* Generation (Blue solid line)
* Multiple-Choice (Orange dashed line)
* Correct Flip (Black solid line with circle markers)
* Incorrect Flip (Black dashed line with plus markers)
* **Title:** "Llama-3.1-8B" positioned at the top-center.
* **Gridlines:** Horizontal gridlines are present to aid in reading values.
### Detailed Analysis
Here's a breakdown of each line's trend and approximate data points:
* **Generation (Blue solid line):** The line generally slopes downward.
* Iteration 1: Approximately 0.095
* Iteration 2: Approximately 0.09
* Iteration 3: Approximately 0.075
* Iteration 4: Approximately 0.08
* Iteration 5: Approximately 0.05
* **Multiple-Choice (Orange dashed line):** This line exhibits a more fluctuating pattern, initially decreasing then increasing before decreasing again.
* Iteration 1: Approximately 0.14
* Iteration 2: Approximately 0.145
* Iteration 3: Approximately 0.15
* Iteration 4: Approximately 0.13
* Iteration 5: Approximately 0.10
* **Correct Flip (Black solid line with circle markers):** This line shows a slight downward trend with some variation.
* Iteration 1: Approximately 0.09
* Iteration 2: Approximately 0.085
* Iteration 3: Approximately 0.08
* Iteration 4: Approximately 0.08
* Iteration 5: Approximately 0.06
* **Incorrect Flip (Black dashed line with plus markers):** This line also shows a downward trend, becoming more pronounced towards the end.
* Iteration 1: Approximately 0.085
* Iteration 2: Approximately 0.08
* Iteration 3: Approximately 0.07
* Iteration 4: Approximately 0.07
* Iteration 5: Approximately 0.04
### Key Observations
* The "Multiple-Choice" method consistently has the highest proportion of flips throughout all iterations.
* Both "Generation" and "Incorrect Flip" show a clear decreasing trend in the proportion of flips as iterations increase.
* "Correct Flip" remains relatively stable, with a slight decrease over time.
* The "Generation" and "Incorrect Flip" lines converge towards the end of the iterations.
### Interpretation
The data suggests that as the number of iterations increases, the "Generation" method and the occurrence of "Incorrect Flips" become less frequent. This could indicate that the model is becoming more stable or refined with each iteration, leading to fewer errors and more consistent outputs. The consistently high proportion of flips for the "Multiple-Choice" method might suggest that this approach is more prone to changes or variations, or that it is exploring a wider range of possibilities. The relatively stable "Correct Flip" rate indicates a baseline level of successful outcomes that doesn't significantly change with iterations. The convergence of "Generation" and "Incorrect Flip" at iteration 5 could imply that the model is reaching a point where the generated outputs are less likely to be incorrect, or that the distinction between them is becoming blurred. The model "Llama-3.1-8B" appears to be improving in its stability and accuracy over the observed iterations.