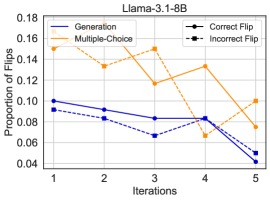
## Line Chart: Llama-3.1-8B - Proportion of Flips Over Iterations
### Overview
This is a line chart titled "Llama-3.1-8B" that plots the "Proportion of Flips" against "Iterations" for four distinct data series. The chart appears to track the performance or behavior of a model (likely a large language model) across five sequential iterations, measuring different types of "flips" or changes.
### Components/Axes
* **Chart Title:** "Llama-3.1-8B" (centered at the top).
* **X-Axis:** Labeled "Iterations". It has five discrete, equally spaced tick marks labeled 1, 2, 3, 4, and 5.
* **Y-Axis:** Labeled "Proportion of Flips". The scale is linear, ranging from 0.04 to 0.18, with major tick marks at intervals of 0.02 (0.04, 0.06, 0.08, 0.10, 0.12, 0.14, 0.16, 0.18).
* **Legend:** Positioned in the top-right corner of the plot area. It defines four series:
1. **Generation:** Solid blue line.
2. **Multiple-Choice:** Solid orange line.
3. **Correct Flip:** Dashed blue line.
4. **Incorrect Flip:** Dashed orange line.
### Detailed Analysis
The following data points are approximate values extracted by visually aligning each line's position at each iteration tick with the y-axis scale.
**1. Generation (Solid Blue Line)**
* **Trend:** Shows a steady, gradual downward trend across all five iterations.
* **Data Points:**
* Iteration 1: ~0.10
* Iteration 2: ~0.09
* Iteration 3: ~0.085
* Iteration 4: ~0.08
* Iteration 5: ~0.05
**2. Multiple-Choice (Solid Orange Line)**
* **Trend:** Starts high, dips at iteration 3, recovers slightly at iteration 4, then drops again. Overall trend is downward.
* **Data Points:**
* Iteration 1: ~0.15
* Iteration 2: ~0.14
* Iteration 3: ~0.12
* Iteration 4: ~0.14
* Iteration 5: ~0.08
**3. Correct Flip (Dashed Blue Line)**
* **Trend:** Follows a similar downward trajectory to the "Generation" line but is consistently lower in value.
* **Data Points:**
* Iteration 1: ~0.09
* Iteration 2: ~0.085
* Iteration 3: ~0.07
* Iteration 4: ~0.085
* Iteration 5: ~0.04
**4. Incorrect Flip (Dashed Orange Line)**
* **Trend:** Exhibits the most volatile behavior. It starts high, dips slightly, spikes to the highest point on the chart at iteration 3, then drops sharply.
* **Data Points:**
* Iteration 1: ~0.15
* Iteration 2: ~0.14
* Iteration 3: ~0.15 (Peak value for this series and the entire chart)
* Iteration 4: ~0.07
* Iteration 5: ~0.10
### Key Observations
1. **General Decline:** All four metrics show a lower proportion of flips at iteration 5 compared to iteration 1, suggesting an overall reduction in the measured phenomenon over time.
2. **Volatility of Incorrect Flips:** The "Incorrect Flip" series is an outlier in its pattern. It does not follow a smooth decline, instead showing a significant spike at iteration 3 before falling.
3. **Correlation of Line Styles:** The two dashed lines ("Correct Flip" and "Incorrect Flip") generally show more volatility than their solid-line counterparts ("Generation" and "Multiple-Choice").
4. **Convergence at Iteration 5:** By the final iteration, the values for "Generation" and "Correct Flip" are very close (~0.05 and ~0.04), as are the values for "Multiple-Choice" and "Incorrect Flip" (~0.08 and ~0.10), though the latter pair remains higher.
### Interpretation
This chart likely visualizes the results of an iterative evaluation or training process for the Llama-3.1-8B model. The "Proportion of Flips" could refer to changes in model outputs, such as flipping an answer choice or altering a generated response between iterations.
* **What the data suggests:** The general downward trend indicates that as the process iterates, the model's outputs become more stable (fewer flips). The distinction between "Correct" and "Incorrect" flips implies an evaluation against a ground truth. The spike in "Incorrect Flips" at iteration 3 is a critical anomaly. It suggests that at this specific stage, the model underwent a period of significant but erroneous change, potentially indicating a problematic update or a challenging evaluation batch.
* **How elements relate:** The solid lines ("Generation", "Multiple-Choice") may represent aggregate flip rates for different task types, while the dashed lines break these down into correct vs. incorrect changes. The fact that "Incorrect Flip" can spike independently (as at iteration 3) shows that the volume of changes is not perfectly correlated with the quality of those changes.
* **Notable anomaly:** The iteration 3 spike in "Incorrect Flip" is the most salient feature. An investigator would want to examine what occurred at this iteration—was there a change in the model's parameters, the evaluation dataset, or the prompting strategy? This point represents a moment of high instability and error introduction. The subsequent drop by iteration 4 suggests a recovery or correction.