## Line Chart: Proportion of Flips in Llama-3.1-8B Across Iterations
### Overview
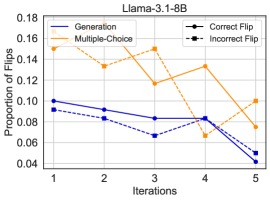
The chart illustrates the proportion of flips (correct and incorrect) for two methods—**Generation** and **Multiple-Choice**—across five iterations. The y-axis represents the proportion of flips (0.04–0.18), while the x-axis denotes iterations (1–5). Two lines and two marker series are plotted, with distinct colors and symbols for clarity.
### Components/Axes
- **X-axis (Iterations)**: Labeled "Iterations," with values 1 to 5.
- **Y-axis (Proportion of Flips)**: Labeled "Proportion of Flips," scaled from 0.04 to 0.18.
- **Legend**: Located in the top-right corner, with:
- **Correct Flip**: Black dot (dashed line).
- **Incorrect Flip**: Black square (dashed line).
- **Lines**:
- **Generation**: Solid blue line.
- **Multiple-Choice**: Solid orange line.
### Detailed Analysis
#### Generation (Blue Line)
- **Trend**: Starts at ~0.10 (iteration 1), decreases steadily to ~0.04 by iteration 5.
- **Data Points**:
- Iteration 1: ~0.10
- Iteration 2: ~0.09
- Iteration 3: ~0.08
- Iteration 4: ~0.08
- Iteration 5: ~0.04
#### Multiple-Choice (Orange Line)
- **Trend**: Peaks at ~0.18 (iteration 2), then declines to ~0.08 by iteration 5, with fluctuations.
- **Data Points**:
- Iteration 1: ~0.16
- Iteration 2: ~0.18
- Iteration 3: ~0.12
- Iteration 4: ~0.14
- Iteration 5: ~0.08
#### Correct Flip (Black Dots)
- **Trend**: Starts at ~0.09 (iteration 1), decreases to ~0.05 by iteration 5.
- **Data Points**:
- Iteration 1: ~0.09
- Iteration 2: ~0.08
- Iteration 3: ~0.07
- Iteration 4: ~0.08
- Iteration 5: ~0.05
#### Incorrect Flip (Black Squares)
- **Trend**: Starts at ~0.01 (iteration 1), peaks at ~0.03 (iteration 3), then drops to ~0.01 by iteration 5.
- **Data Points**:
- Iteration 1: ~0.01
- Iteration 2: ~0.02
- Iteration 3: ~0.03
- Iteration 4: ~0.02
- Iteration 5: ~0.01
### Key Observations
1. **Generation Method**: Shows a consistent decline in flip proportion, suggesting improved stability or reduced variability over iterations.
2. **Multiple-Choice Method**: Exhibits volatility, with a sharp peak in iteration 2 followed by a gradual decline. The highest proportion of flips occurs in iteration 2.
3. **Correct Flip**: Declines steadily, indicating a reduction in correct flips over time, which may reflect diminishing accuracy or increased errors.
4. **Incorrect Flip**: Peaks in iteration 3, suggesting a temporary spike in errors, followed by a sharp decline.
### Interpretation
- The **Generation** method demonstrates a more stable and controlled performance, with a clear downward trend in flip proportion. This could imply that the model becomes more reliable or less prone to errors as iterations progress.
- The **Multiple-Choice** method shows erratic behavior, with a significant peak in iteration 2. This might indicate a temporary increase in flip activity, possibly due to model adjustments or data variability.
- The **Correct Flip** and **Incorrect Flip** markers reveal a trade-off: as total flips decrease (Generation), correct flips also decline, while incorrect flips remain low but spike temporarily. This suggests that the model’s accuracy may be improving, but the reduction in total flips could be due to fewer opportunities for errors rather than enhanced correctness.
- The **Incorrect Flip** spike in iteration 3 highlights a potential anomaly or instability in the model’s behavior during that phase, warranting further investigation.
This chart underscores the importance of balancing flip proportion with accuracy, as reducing total flips does not necessarily equate to improved performance if correct flips are also declining.