## Horizontal Bar Chart: Model Performance Comparison
### Overview
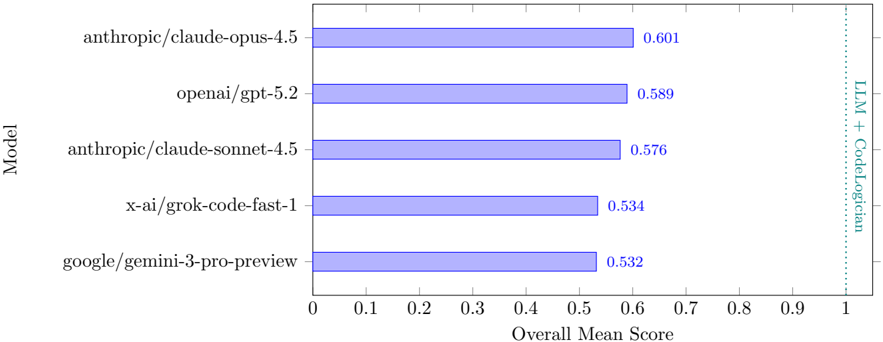
The image is a horizontal bar chart comparing the overall mean scores of several language models (LLMs) on a specific task, presumably related to code generation or understanding, as indicated by the "LLM + CodeLogician" label. The chart displays the performance of models from Anthropic, OpenAI, X-AI, and Google.
### Components/Axes
* **Y-axis (left)**: "Model" - Lists the names of the language models being compared.
* Models:
* anthropic/claude-opus-4.5
* openai/gpt-5.2
* anthropic/claude-sonnet-4.5
* x-ai/grok-code-fast-1
* google/gemini-3-pro-preview
* **X-axis (bottom)**: "Overall Mean Score" - Numerical scale ranging from 0 to 1, with increments of 0.1.
* **Bars**: Horizontal bars representing the overall mean score for each model. The bars are a light blue color.
* **Values**: Numerical values displayed at the end of each bar, indicating the exact overall mean score.
* **Vertical Dotted Line (right)**: A vertical dotted line at x=1, labeled "LLM + CodeLogician" in teal.
### Detailed Analysis
The chart presents the following data:
* **anthropic/claude-opus-4.5**: Score of 0.601. The bar extends to approximately 60% of the x-axis.
* **openai/gpt-5.2**: Score of 0.589. The bar extends to approximately 59% of the x-axis.
* **anthropic/claude-sonnet-4.5**: Score of 0.576. The bar extends to approximately 58% of the x-axis.
* **x-ai/grok-code-fast-1**: Score of 0.534. The bar extends to approximately 53% of the x-axis.
* **google/gemini-3-pro-preview**: Score of 0.532. The bar extends to approximately 53% of the x-axis.
### Key Observations
* The anthropic/claude-opus-4.5 model has the highest overall mean score (0.601).
* The google/gemini-3-pro-preview model has the lowest overall mean score (0.532).
* The scores are relatively close, with a range of approximately 0.07 between the highest and lowest scores.
### Interpretation
The chart provides a comparison of the overall performance of several language models. The anthropic/claude-opus-4.5 model appears to outperform the others in this specific evaluation. The "LLM + CodeLogician" label suggests that the models were evaluated on tasks that involve both language understanding and code-related abilities. The proximity of the scores suggests that all models are reasonably competent, but there are still performance differences. The vertical line at 1.0 indicates the maximum possible score, and all models fall significantly short of this maximum, suggesting room for improvement in all models.