\n
## Scatter Plot: Accuracy vs. Time-to-Answer
### Overview
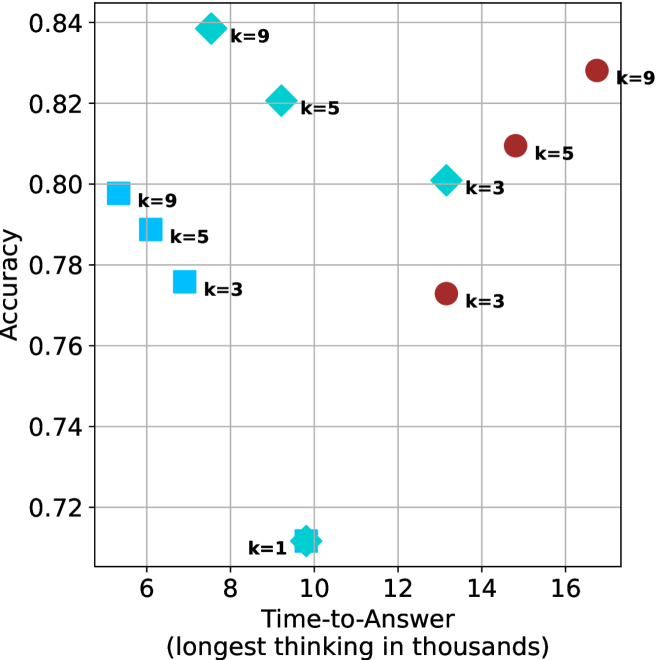
This image presents a scatter plot illustrating the relationship between Accuracy and Time-to-Answer (measured in thousands of units). The data points are color-coded based on the value of 'k', representing a parameter likely related to the underlying process being measured.
### Components/Axes
* **X-axis:** Time-to-Answer (longest thinking in thousands) - Scale ranges from approximately 5.5 to 17.
* **Y-axis:** Accuracy - Scale ranges from approximately 0.71 to 0.84.
* **Data Points:** Scatter plot points, color-coded by 'k' value.
* **Legend:** Located in the top-right corner, associating colors with 'k' values:
* Blue: k=1
* Light Blue: k=3
* Light Green: k=5
* Red: k=9
### Detailed Analysis
The plot contains data points for k=1, k=3, k=5, and k=9.
* **k=1 (Blue):** One data point at approximately (6.2, 0.71).
* **k=3 (Light Blue):** Two data points: one at approximately (6.4, 0.78) and another at approximately (14.2, 0.79).
* **k=5 (Light Green):** Two data points: one at approximately (10.3, 0.82) and another at approximately (15.2, 0.81).
* **k=9 (Red):** Two data points: one at approximately (10.6, 0.83) and another at approximately (16.5, 0.82).
**Trends:**
* For k=3, the accuracy appears to slightly increase with time-to-answer.
* For k=5, the accuracy is relatively stable across the observed time-to-answer range.
* For k=9, the accuracy is relatively stable across the observed time-to-answer range.
* k=1 has the lowest accuracy and shortest time-to-answer.
### Key Observations
* Higher values of 'k' generally correlate with higher accuracy, but the relationship isn't strictly linear.
* The data suggests a potential trade-off between accuracy and time-to-answer. Lower 'k' values result in faster response times but lower accuracy.
* There is some overlap in the time-to-answer ranges for different 'k' values.
* The data points are relatively sparse, making it difficult to draw definitive conclusions.
### Interpretation
The data suggests that the parameter 'k' influences both the accuracy and the time-to-answer of a process. Increasing 'k' appears to improve accuracy, but it may also increase the time required to reach an answer. The optimal value of 'k' likely depends on the specific application and the relative importance of accuracy versus speed.
The scatter plot indicates that the relationship between time-to-answer and accuracy is not simple. While there's a general trend of increasing accuracy with increasing 'k', the data points don't follow a clear, predictable pattern. This could be due to other factors influencing the process, or it could simply be a result of the limited number of data points.
The fact that k=1 has a significantly lower accuracy and shorter time-to-answer suggests that this value might represent a very simple or fast, but less reliable, approach. Conversely, k=9 might represent a more complex and thorough, but slower, approach. The values of k=3 and k=5 appear to offer intermediate trade-offs between speed and accuracy.