## Scatter Plot: Accuracy vs. Time-to-Answer (Longest in Thousands)
### Overview
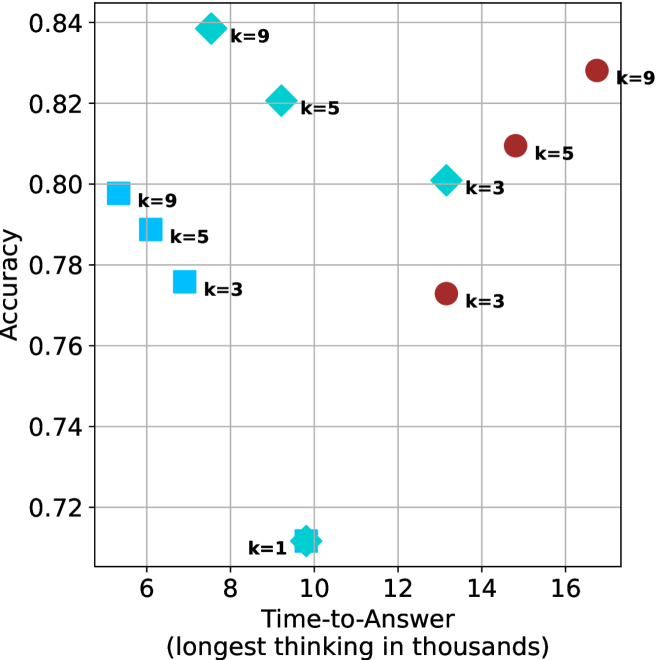
The image is a scatter plot comparing **accuracy** (y-axis) and **time-to-answer** (x-axis, in thousands of units) for different configurations labeled by `k` values (1, 3, 5, 9). Data points are color-coded and marked with distinct symbols (squares, diamonds, circles, stars) corresponding to their `k` values. The plot includes a grid for reference.
---
### Components/Axes
- **X-axis (Time-to-Answer)**: Labeled "Time-to-Answer (longest in thousands)" with values ranging from 6 to 16 (in thousands).
- **Y-axis (Accuracy)**: Labeled "Accuracy" with values ranging from 0.72 to 0.84.
- **Legend**: Located on the right, mapping colors and markers to `k` values:
- `k=9`: Blue squares
- `k=5`: Teal diamonds
- `k=3`: Red circles
- `k=1`: Cyan star
---
### Detailed Analysis
#### Data Points by `k` Value
1. **`k=9` (Blue Squares)**
- (6, 0.78)
- (8, 0.84)
- (16, 0.83)
2. **`k=5` (Teal Diamonds)**
- (8, 0.82)
- (12, 0.80)
- (14, 0.81)
3. **`k=3` (Red Circles)**
- (6, 0.77)
- (12, 0.78)
- (14, 0.77)
4. **`k=1` (Cyan Star)**
- (10, 0.71)
---
### Key Observations
1. **Highest Accuracy**:
- `k=9` at time 8 (0.84) is the highest accuracy observed.
- `k=1` at time 10 (0.71) is the lowest accuracy.
2. **Time-Accuracy Trade-off**:
- For `k=9`, accuracy peaks at time 8 (0.84) but drops slightly at time 16 (0.83).
- `k=5` shows a slight decline in accuracy as time increases (0.82 → 0.80 → 0.81).
- `k=3` maintains relatively stable accuracy (0.77–0.78) across times 6, 12, and 14.
3. **Outliers**:
- The `k=1` point (10, 0.71) is an outlier, with the lowest accuracy despite a moderate time-to-answer.
4. **Trends**:
- No strict linear relationship between time and accuracy. For example:
- `k=9` has higher accuracy at time 8 than at time 6 (0.84 vs. 0.78).
- `k=5` at time 14 (0.81) is lower than at time 8 (0.82).
---
### Interpretation
- **Accuracy vs. Time**:
Higher `k` values (e.g., 9, 5) generally achieve higher accuracy but do not consistently correlate with shorter time-to-answer. For instance, `k=9` at time 16 (0.83) performs better than `k=5` at time 12 (0.80).
- **`k=1` Anomaly**:
The `k=1` point (10, 0.71) deviates significantly from other `k` values, suggesting either a unique configuration or an outlier in the dataset.
- **Nonlinear Relationships**:
Accuracy does not monotonically increase or decrease with time. For example, `k=9` achieves peak accuracy at time 8 but maintains high accuracy at time 16.
- **Practical Implications**:
The plot highlights a trade-off between accuracy and computational time, but the relationship is context-dependent. Configurations with higher `k` values may prioritize accuracy over speed, while lower `k` values (e.g., `k=1`) underperform in both metrics.
---
### Spatial Grounding & Validation
- **Legend Placement**: Right-aligned, clearly associating colors/markers with `k` values.
- **Data Point Validation**:
- `k=9` (blue squares) matches all three points.
- `k=5` (teal diamonds) aligns with three points.
- `k=3` (red circles) and `k=1` (cyan star) are correctly mapped.
---
### Conclusion
The scatter plot reveals that higher `k` values generally improve accuracy but do not guarantee faster responses. The `k=1` configuration is an outlier, underperforming in both accuracy and time. The data suggests that optimizing `k` requires balancing accuracy and computational efficiency, with no universal optimal value across all scenarios.