## Line Graphs: Performance Comparison of NeurRL(N) and NeurRL(R) Across Parameters
### Overview
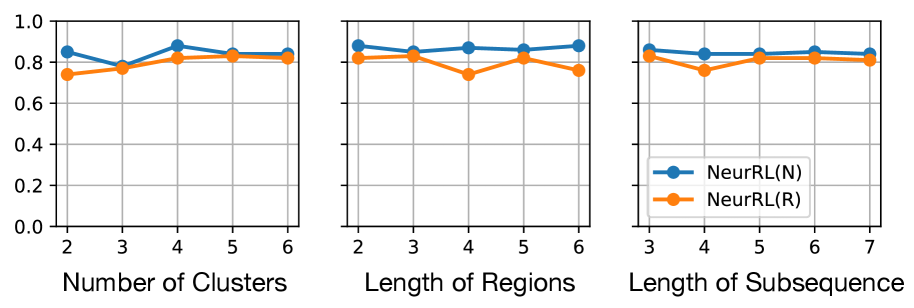
The image contains three line graphs comparing the performance of two models, **NeurRL(N)** (blue) and **NeurRL(R)** (orange), across three distinct parameters:
1. **Number of Clusters** (x-axis: 2–6)
2. **Length of Regions** (x-axis: 2–6)
3. **Length of Subsequence** (x-axis: 3–7)
The y-axis represents a normalized performance metric (0.0–1.0) for all graphs. Both models exhibit similar trends, with **NeurRL(N)** consistently outperforming **NeurRL(R)** by small margins.
---
### Components/Axes
#### Common Elements:
- **Legend**: Located at the bottom-right corner of all graphs, with:
- Blue circles: **NeurRL(N)**
- Orange circles: **NeurRL(R)**
- **Y-axis**: Labeled "Performance Metric" (0.0–1.0 in increments of 0.2).
- **X-axes**:
1. **Number of Clusters**: 2–6 (integer values).
2. **Length of Regions**: 2–6 (integer values).
3. **Length of Subsequence**: 3–7 (integer values).
#### Graph-Specific Details:
1. **Number of Clusters**:
- **NeurRL(N)**: Peaks at ~0.88 (4 clusters), dips to ~0.78 (3 clusters), stabilizes at ~0.85 (5–6 clusters).
- **NeurRL(R)**: Peaks at ~0.85 (4 clusters), dips to ~0.75 (2 clusters), stabilizes at ~0.83 (5–6 clusters).
2. **Length of Regions**:
- **NeurRL(N)**: Peaks at ~0.88 (2 regions), dips to ~0.85 (3 regions), stabilizes at ~0.87 (4–6 regions).
- **NeurRL(R)**: Peaks at ~0.87 (3 regions), dips to ~0.78 (4 regions), stabilizes at ~0.85 (5–6 regions).
3. **Length of Subsequence**:
- **NeurRL(N)**: Peaks at ~0.88 (3 subsequences), dips to ~0.86 (4 subsequences), stabilizes at ~0.87 (5–7 subsequences).
- **NeurRL(R)**: Peaks at ~0.85 (3 subsequences), dips to ~0.82 (4 subsequences), stabilizes at ~0.84 (5–7 subsequences).
---
### Detailed Analysis
#### Trends:
- **NeurRL(N)** consistently outperforms **NeurRL(R)** across all parameters, with performance differences ranging from ~0.03 to ~0.06.
- Both models show **plateaus** after optimal parameter values (e.g., 4 clusters, 4 regions, 5 subsequences), suggesting diminishing returns beyond these points.
- **NeurRL(R)** exhibits sharper dips in performance at specific parameter values (e.g., 4 regions, 4 subsequences) compared to **NeurRL(N)**.
#### Spatial Grounding:
- Legends are consistently positioned at the **bottom-right** of all graphs.
- Data points align with legend colors: blue for **NeurRL(N)**, orange for **NeurRL(R)**.
---
### Key Observations
1. **Performance Gaps**:
- **NeurRL(N)** maintains a ~0.03–0.06 advantage over **NeurRL(R)** in all graphs.
- Largest gap observed in the **Number of Clusters** graph (0.03 at 2 clusters).
2. **Parameter Sensitivity**:
- **NeurRL(R)** is more sensitive to parameter changes (e.g., sharp dip at 4 regions).
- **NeurRL(N)** shows smoother performance curves with fewer fluctuations.
3. **Optimal Parameters**:
- **NeurRL(N)**: Optimal at 4 clusters, 2 regions, and 5 subsequences.
- **NeurRL(R)**: Optimal at 4 clusters, 3 regions, and 3 subsequences.
---
### Interpretation
The data suggests that **NeurRL(N)** is more robust to parameter variations, maintaining higher performance across all tested configurations. The plateaus indicate that increasing parameters beyond certain thresholds (e.g., >4 clusters) yields minimal gains, highlighting potential inefficiencies in scaling. **NeurRL(R)**’s sharper dips suggest it may struggle with specific parameter configurations, requiring careful tuning. These trends could inform model selection based on the trade-off between performance stability and parameter sensitivity.