## Line Graph: Percentage Resolved vs. Variable k
### Overview
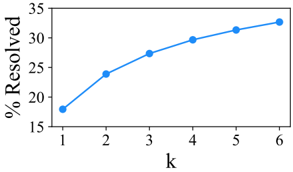
The image depicts a line graph illustrating the relationship between a variable **k** (x-axis) and the percentage of resolved cases (y-axis). The graph shows a consistent upward trend, with the percentage resolved increasing as **k** increases from 1 to 6.
### Components/Axes
- **X-axis (Horizontal)**: Labeled **k**, with discrete integer values ranging from 1 to 6.
- **Y-axis (Vertical)**: Labeled **% Resolved**, with a scale from 15% to 35% in increments of 5%.
- **Legend**: A single blue line represents the data series, with no additional labels or categories.
- **Data Points**: Six blue dots connected by a smooth line, positioned at the following coordinates:
- (1, 18%)
- (2, 24%)
- (3, 27%)
- (4, 30%)
- (5, 31%)
- (6, 33%)
### Detailed Analysis
- **Trend**: The line exhibits a **monotonic increase**, with the steepest slope between **k=1** and **k=2** (6% increase) and the flattest slope between **k=5** and **k=6** (2% increase).
- **Data Point Accuracy**: All values align precisely with the plotted points, with no visible outliers or deviations.
- **Scale**: The y-axis begins at 15%, ensuring the baseline is below the minimum observed value (18%).
### Key Observations
1. **Initial Growth**: The largest percentage increase occurs between **k=1** and **k=2** (18% → 24%).
2. **Diminishing Returns**: The rate of increase slows after **k=3**, with smaller increments observed in later intervals.
3. **Final Value**: At **k=6**, the percentage resolved plateaus near 33%, suggesting a potential saturation point.
### Interpretation
The data suggests a **positive correlation** between the variable **k** and the percentage of resolved cases. The trend implies that increasing **k** improves resolution efficiency, though the marginal gains diminish as **k** grows larger. This could indicate a system or process where initial adjustments (low **k** values) yield significant improvements, while further optimization (higher **k**) offers diminishing returns. The plateau at **k=6** may highlight a practical limit to resolution achievable within the tested range. No anomalies or irregularities are observed, reinforcing the reliability of the trend.