## Chart: LM Loss vs. PFLOP/s-days for MoBA and Full Attention Projections
### Overview
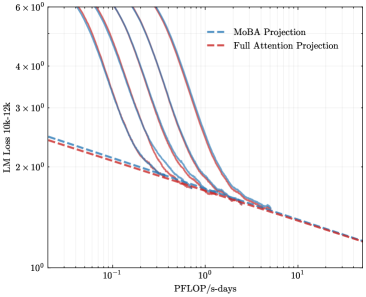
The image is a line chart comparing the Language Model (LM) Loss of MoBA Projection and Full Attention Projection models against PFLOP/s-days (a measure of computational cost). The chart displays multiple lines for each projection type, likely representing different model configurations or runs.
### Components/Axes
* **X-axis:** PFLOP/s-days (logarithmic scale from approximately 0.03 to 10)
* **Y-axis:** LM Loss 10k-12k (logarithmic scale from 1 to 6 x 10^0)
* **Legend (top-right):**
* Blue dashed line: MoBA Projection
* Red dashed line: Full Attention Projection
### Detailed Analysis
* **MoBA Projection (Blue):** There are multiple blue lines. All lines show a decreasing trend as PFLOP/s-days increases.
* The leftmost blue line starts at approximately LM Loss = 6 around PFLOP/s-days = 0.03, decreasing to approximately LM Loss = 1.5 around PFLOP/s-days = 1.
* The rightmost blue line starts at approximately LM Loss = 4.5 around PFLOP/s-days = 0.03, decreasing to approximately LM Loss = 1.5 around PFLOP/s-days = 1.
* The dashed blue line starts at approximately LM Loss = 2.5 around PFLOP/s-days = 0.03, decreasing to approximately LM Loss = 1.2 around PFLOP/s-days = 10.
* **Full Attention Projection (Red):** There are multiple red lines. All lines show a decreasing trend as PFLOP/s-days increases.
* The leftmost red line starts at approximately LM Loss = 6 around PFLOP/s-days = 0.03, decreasing to approximately LM Loss = 1.5 around PFLOP/s-days = 1.
* The rightmost red line starts at approximately LM Loss = 4.5 around PFLOP/s-days = 0.03, decreasing to approximately LM Loss = 1.5 around PFLOP/s-days = 1.
* The dashed red line starts at approximately LM Loss = 2.5 around PFLOP/s-days = 0.03, decreasing to approximately LM Loss = 1.2 around PFLOP/s-days = 10.
### Key Observations
* Both MoBA and Full Attention Projections show a decrease in LM Loss as PFLOP/s-days increases, indicating that more computation leads to lower loss.
* The dashed lines for both MoBA and Full Attention Projections are very close to each other, suggesting similar performance characteristics for these specific configurations.
* The solid lines for both MoBA and Full Attention Projections are very close to each other, suggesting similar performance characteristics for these specific configurations.
* At lower PFLOP/s-days values, there is a wider spread in LM Loss values for both projection types, suggesting variability in performance depending on the specific model configuration.
### Interpretation
The chart suggests that increasing computational resources (PFLOP/s-days) generally leads to a reduction in LM Loss for both MoBA and Full Attention Projection models. The close proximity of the dashed lines indicates that, for certain configurations, the two projection methods achieve comparable performance. The spread in LM Loss values at lower PFLOP/s-days suggests that the performance of these models is more sensitive to other factors (e.g., model architecture, hyperparameters) when computational resources are limited. The dashed lines appear to represent a more optimized or stable configuration, as they exhibit a smoother and more consistent decrease in LM Loss with increasing PFLOP/s-days.