\n
## Line Graph: LM Loss vs. Compute (PFLOP/s-days)
### Overview
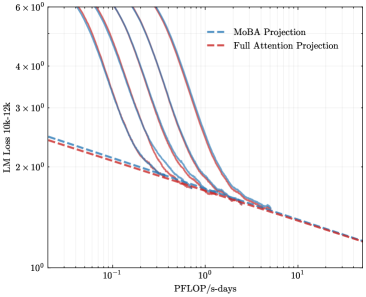
The image is a log-log line graph comparing the scaling behavior of two projection methods for Language Model (LM) loss as a function of computational resources. The graph demonstrates how model loss decreases with increased training compute, measured in PetaFLOP/s-days.
### Components/Axes
* **Chart Type:** Log-log line plot.
* **X-Axis (Horizontal):**
* **Label:** `PFLOP/s-days`
* **Scale:** Logarithmic, ranging from `10^-1` (0.1) to `10^1` (10).
* **Major Ticks:** `10^-1`, `10^0` (1), `10^1`.
* **Y-Axis (Vertical):**
* **Label:** `LM Loss (10k, 128k)`
* **Scale:** Logarithmic, ranging from `10^0` (1) to `6 x 10^0` (6).
* **Major Ticks:** `10^0`, `2 x 10^0`, `3 x 10^0`, `4 x 10^0`, `6 x 10^0`.
* **Legend:**
* **Position:** Top-right corner of the plot area.
* **Entry 1:** `MoBA Projection` - Represented by a blue dashed line (`--`).
* **Entry 2:** `Full Attention Projection` - Represented by a red dashed line (`--`).
* **Data Series:**
* There are multiple solid lines (approximately 6-7) in varying shades of purple, blue, and red. These represent individual model training runs or data series.
* Two prominent dashed projection lines (blue and red) overlay the solid lines, representing the fitted scaling laws.
### Detailed Analysis
* **General Trend:** All lines, both solid and dashed, exhibit a strong downward slope from left to right. This indicates a consistent inverse relationship: as the computational budget (`PFLOP/s-days`) increases, the `LM Loss` decreases.
* **Projection Lines (Dashed):**
* The **blue dashed line (`MoBA Projection`)** starts at approximately `LM Loss ≈ 2.5` at `PFLOP/s-days = 0.1`. It follows a smooth, slightly convex curve downward, passing near `Loss ≈ 1.8` at `1 PFLOP/s-day` and ending near `Loss ≈ 1.2` at `10 PFLOP/s-days`.
* The **red dashed line (`Full Attention Projection`)** starts slightly lower than the blue line at `0.1 PFLOP/s-days`, at approximately `Loss ≈ 2.4`. It follows a very similar trajectory, remaining just below the blue line for most of the range, and converges with it near `10 PFLOP/s-days` at `Loss ≈ 1.2`.
* **Solid Data Lines:** The solid lines represent actual data points. They are tightly clustered and generally follow the path of the projection lines, though with more local variation (wiggles). They all originate from high loss values (above `6 x 10^0`) at low compute (`< 0.1 PFLOP/s-days`) and converge into a narrow band as compute increases.
* **Key Intersection Points (Approximate):**
* At `1 PFLOP/s-day`, the cluster of solid lines and the projection lines are centered around `LM Loss ≈ 1.8`.
* At `10 PFLOP/s-days`, the projections and the trend of the solid lines converge at `LM Loss ≈ 1.2`.
### Key Observations
1. **Consistent Scaling Law:** The tight alignment of the solid data lines with the smooth dashed projections strongly suggests that LM loss follows a predictable power-law scaling with respect to compute.
2. **Minimal Difference Between Projections:** The `MoBA Projection` (blue) and `Full Attention Projection` (red) are nearly indistinguishable across the entire plotted range. The red line is marginally lower, but the difference is minimal and within the noise of the solid data lines.
3. **Convergence at High Compute:** The projections and data trends suggest that the difference between the two methods, if any, becomes negligible as the computational budget scales into the tens of PFLOP/s-days.
4. **Log-Log Linearity:** The approximately straight-line behavior on this log-log plot is characteristic of a power-law relationship (`Loss ∝ Compute^(-α)`).
### Interpretation
This graph provides empirical evidence for the scaling hypothesis in large language models. It demonstrates that investing more computational resources (`PFLOP/s-days`) during training leads to predictable and significant reductions in model loss (a proxy for capability).
The primary finding is the striking similarity between the `MoBA` and `Full Attention` projection curves. This suggests that, within the observed compute regime, the MoBA (likely a Memory-efficient or Mixture-of-Experts based Attention) architecture achieves a training efficiency nearly identical to that of a standard Full Attention mechanism. This is a significant result, as it implies potential architectural optimizations (like MoBA) can be adopted without sacrificing the fundamental scaling efficiency of the model.
The graph does not show a clear "knee" or point of diminishing returns within the plotted range (`0.1` to `10 PFLOP/s-days`), indicating that further performance gains are likely achievable with even more compute. The tight clustering of the solid lines also indicates high reproducibility in the scaling behavior across different training runs or model configurations.