## [Diagram]: Grid Path Visualization
### Overview
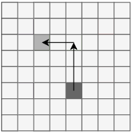
The image displays a 7x7 square grid containing two distinct shaded cells connected by a directional path. The diagram illustrates a two-step movement pattern, likely representing a pathfinding algorithm, coordinate geometry, or a logic flow on a discrete grid. There is no text present in the image.
### Components/Axes
* **Grid Structure:** A 7x7 matrix of equal-sized square cells.
* **Start Point:** A dark gray square located at the intersection of the 5th row and 4th column (counting from the top-left as 1,1).
* **End Point:** A light gray square located at the intersection of the 2nd row and 2nd column.
* **Path Indicator:** A black arrow path originating from the center of the dark gray square, extending vertically upward, and turning 90 degrees to the left to terminate at the center of the light gray square.
### Detailed Analysis
* **Grid Layout:** The grid is uniform, consisting of 49 total cells.
* **Path Geometry:**
* **Vertical Segment:** The path originates at (Row 5, Column 4) and travels vertically upward for 3 grid units, ending at (Row 2, Column 4).
* **Horizontal Segment:** The path turns 90 degrees to the left at (Row 2, Column 4) and travels horizontally for 2 grid units, terminating at (Row 2, Column 2).
* **Visual Hierarchy:** The start point is darker than the end point, suggesting a progression or a transition from a "source" state to a "destination" state.
### Key Observations
* **Manhattan Distance:** The path represents the "Manhattan distance" (or taxicab geometry) between the two points, which is the sum of the absolute differences of their coordinates ($|5-2| + |4-2| = 3 + 2 = 5$ units).
* **Movement Constraints:** The path implies a movement constraint where only vertical and horizontal movement is permitted (no diagonal movement).
* **Directionality:** The arrowheads clearly define the sequence of movement: Vertical first, then Horizontal.
### Interpretation
This diagram is a classic representation of pathfinding in a discrete 2D space. It demonstrates the shortest path between two points on a grid where diagonal movement is prohibited.
* **Algorithmic Context:** This is a standard visualization for algorithms like A* (A-star) or Dijkstra’s algorithm, specifically in scenarios where the "cost" of movement is uniform across the grid.
* **Logic Flow:** The transition from a darker shade to a lighter shade often signifies a "process" or "state change," where the darker cell represents the origin or current state, and the lighter cell represents the target or future state.
* **Peircean Investigative Note:** The lack of labels suggests this is a generic instructional graphic intended to explain the *concept* of grid-based navigation rather than a specific dataset. The "L-shaped" path is the most efficient route, demonstrating the principle of least resistance in a constrained environment.